The data for the charts and tables are collated from official EU customs seizure data released annually by the Directorate-General for Taxation and Customs Union (TAXUD). TAXUD is responsible for the European Commission’s policies on taxation and customs. Data provided by TAXUD on customs seizures infringing intellectual property rights has developed significantly from when first made available in 2000. Originally, only a few charts and tables were provided, but since 2006 the TAXUD has compiled a yearly comprehensive report, including trends and observations. The annual report has been re-branded as “Report on the EU Customs Enforcement of Intellectual Property Rights: Results as the EU Border”. As the report developed, more datapoints were added, the product categories were expanded, and new Member States joined the EU. As such, the data requires substantial processing to facilitate long-term trend analysis. We have done just that, collating, cleansing, and processing the data for you, with a selection of important datapoints visualised below.
Note 1: any record listed as “NR” means Not Reported. This covered data not included for various reasons and which could not be accurately calculated using other datapoints.
Note 2: the latest records available cover the calendar year 2019. The UK officially left the EU 31 January 2020, therefore are UK references remain up until this point.
See here for customs seizure data covering ?? United States & ? World Customs Organization
Contents

Section 1 – EU Customs Seizure Totals
1.1 Total Articles Seized
1.2 Number of Cases
1.3 Estimated Retail Value Articles Seized
1.4 Average Number of Articles Seized per Case
1.5 Average Retail Value per Case
1.6 Average Retail Value per Article
1.7 Trade Mark Infringing Articles & Percentage of Total
1.8 Health & Safety Risk Articles & Percentage of Total
1.9 Date Table for Section 1
Section 2 – Product Category Breakdown
2.1 Foodstuffs, Alcohol, and Other Beverages
2.2 Body Care Items
2.3 Clothing & Accessories
2.4 Shoes
2.5 Personal Accessories
2.6 Mobile Phones
2.7 Electrical / Electronic & Computer Equipment
2.8 CD, DVD, Game Cartridges
2.9 Toys & Games
2.10 Tobacco Products
2.11 Medical Products
2.12 Other
Section 3 – Transport Breakdown
3.1 Transport Breakdown by Articles Seized
3.2 Transport Breakdown by Number of Cases
3.3 Transport Breakdown by Estimated Retail Value
Section 4 – Breakdown of Articles Seized by Member States Breakdown
Sources
Section 1 – EU Customs Seizure Totals
Data in this section relate to headline seizure figures covering: total articles seized for IPR infringement; number of cases; estimated retail value of seized items; average number of articles per case; average retail value per case; average retail value per article; the number of articles seized on the basis of trade mark infringement along with the percentage of total IPR violations relating to trade mark infringement; and the number of high risk articles seized presenting a health & safety concern to the public along with the percentage of total IPR violations relating to such high risk articles.
Articles = each unit seized
Case = number of cases opened
Retail value = the retail value for each article seized multiplied by total number of seized articles
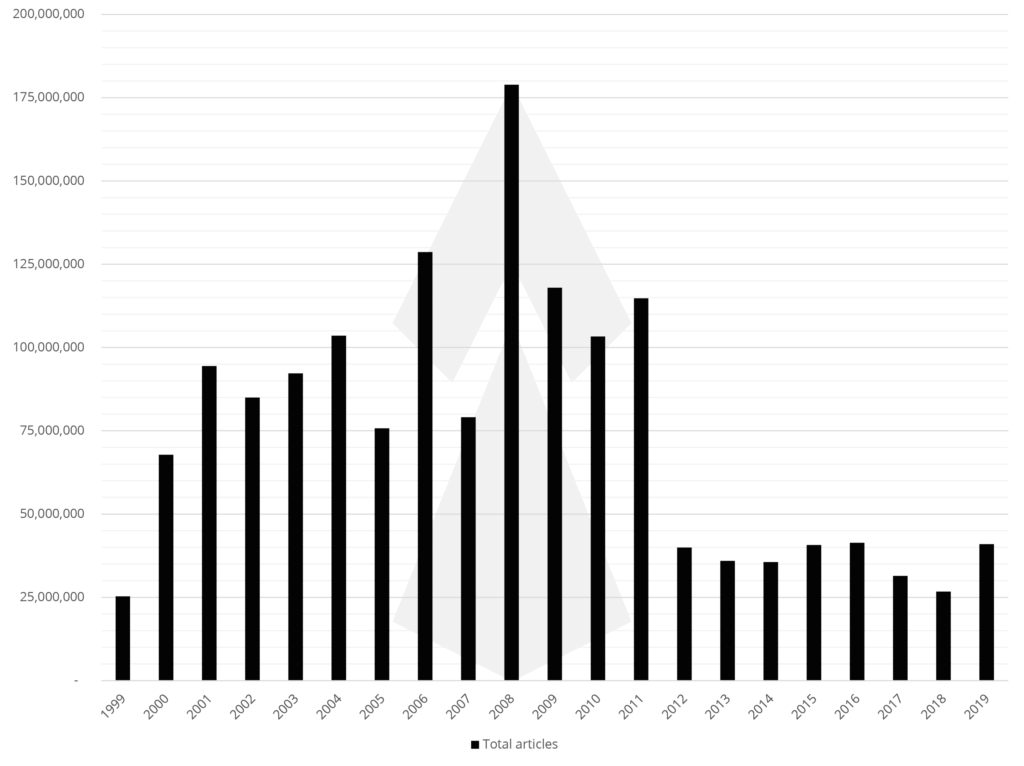
1.1 Total Articles Seized
Total articles seized represents the total number of units seized by EU Customs on the basis of intellectual property infringement. This covers all forms of IPRs, including: copyright, trade marks, patents, design rights, geographical indicators etc. Both Community rights and relevant national rights are in scope of EU Customs. Since 1999, total articles seized has grown by an average of 2.32% per year, from just over 25 million infringing articles in 1999 to almost 41 million infringing articles in 2019.
1.2 Number of Cases
Number of cases represents the cases opened by EU Customs to investigate suspected IPR infringement. A case may cover a single package sent via postal services or a container full of infringing articles. As such, total articles is a better reflection of the scale of IPR infringing goods seized by EU Customs. Since 1999, the number of cases has grown by an average of 15.21% per year, from around 4.7k cases in 1999 to almost almost 92k cases in 2019.

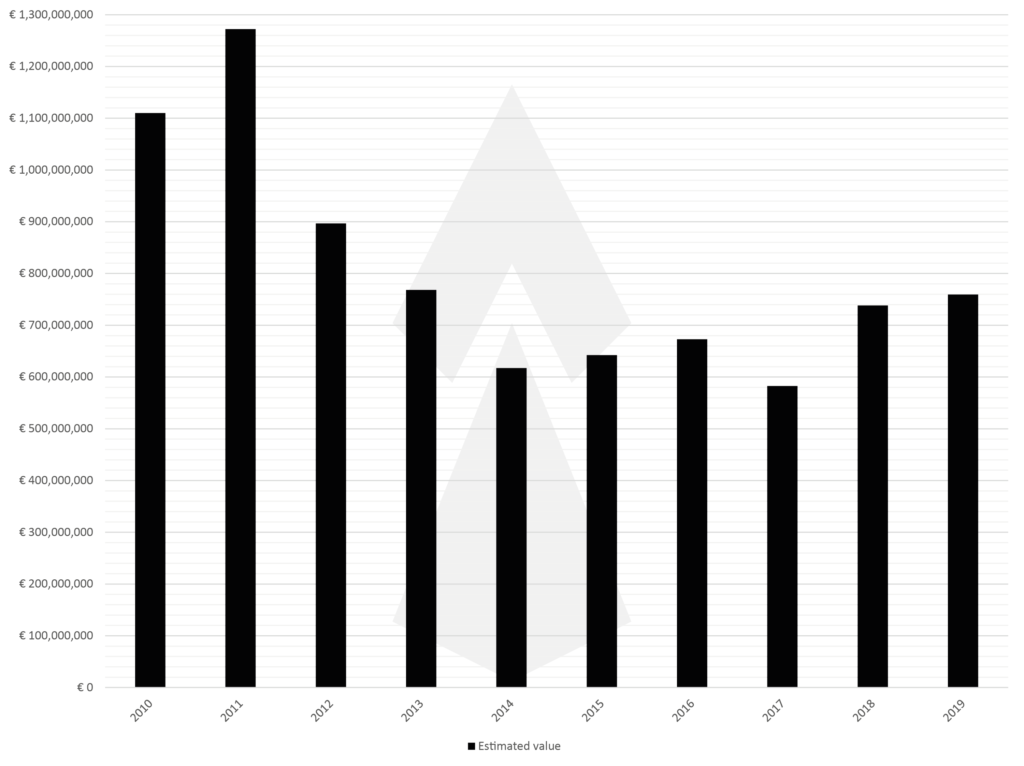
1.3 Estimated Retail Value Articles Seized
Estimated retail value of articles seized is calculated by multiplying the retail value of each article seized by the total number of seized articles. There are various nuances to calculating retail value and is open to significant interpretation. Thus retail value is not a reliable indicator of long-term trends in seizure volume or scale. Estimated value was first introduced by TAXUD in the 2010 reoprt. Since 2010, estimated retail value of articles seized has fallen by an average of 3.73% per year, from €1.1 billion in 2010 to around €760 million in 2019.
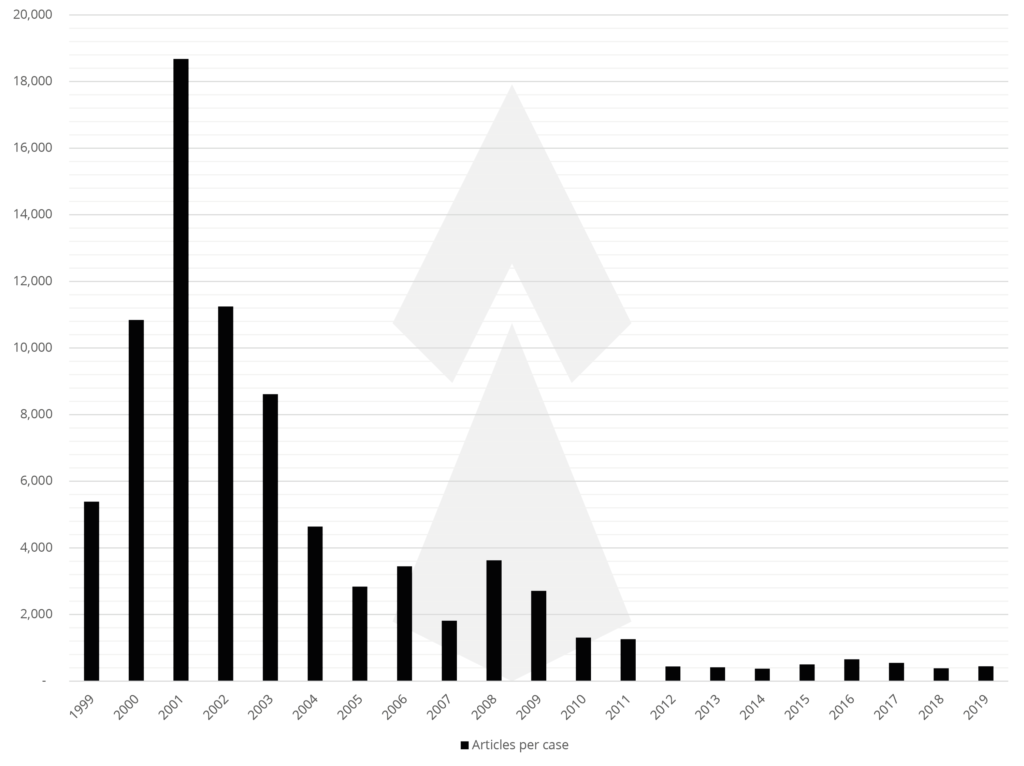
1.4 Average Number of Articles Seized per Case
Average number of articles seized per case is calculated by dividing the total number of articles seized by the number of cases. The smaller the number, the fewer the articles seized per case. This represents the methods and modes use to distribute IPR infringing products into the EU. Since 1999, the average number of articles seized per case has fallen by an average of 11.19% per year, from over 5.3k in 1999 to 446 in 2019.
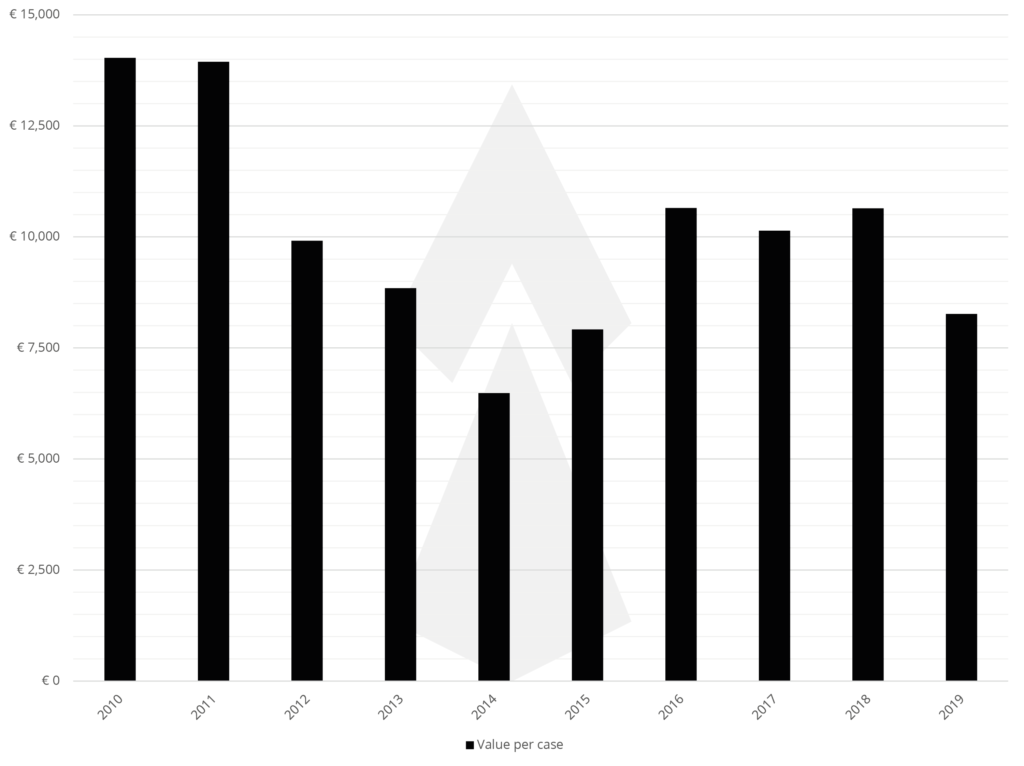
1.5 Average Retail Value per Case
Average retail value per case is calculated by dividing the total retail value by the number of cases. The smaller the number, the lower the value each case represents. Value is measured in Euro. Since 1999, the average average retail value per case has fallen by an average of 5.16% per year, from over €14k in 1999 to just over €8k in 2019.
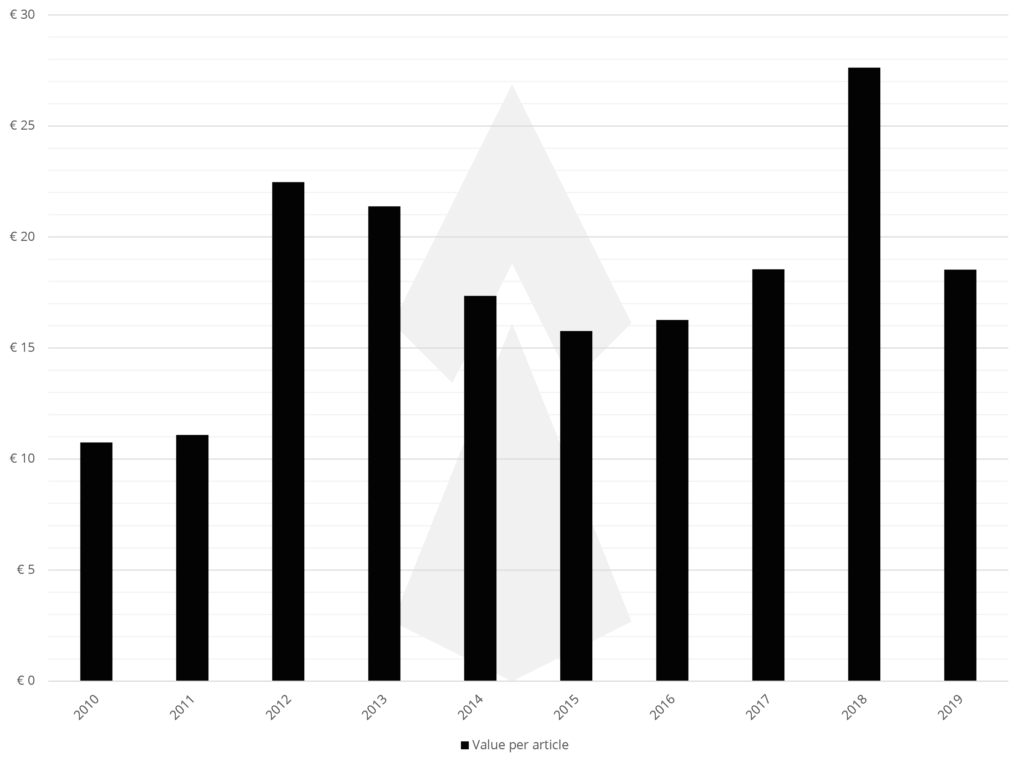
1.6 Average Retail Value per Article
Average retail value per article is calculated by dividing the total retail value by the total number of articles seized. The smaller the number, the lower the value each artticle seized represents. Value is measured in Euro. Since 1999, the average retail value per article has increased by an average of 5.6% per year, from €11 in 1999 to €19 in 2019.
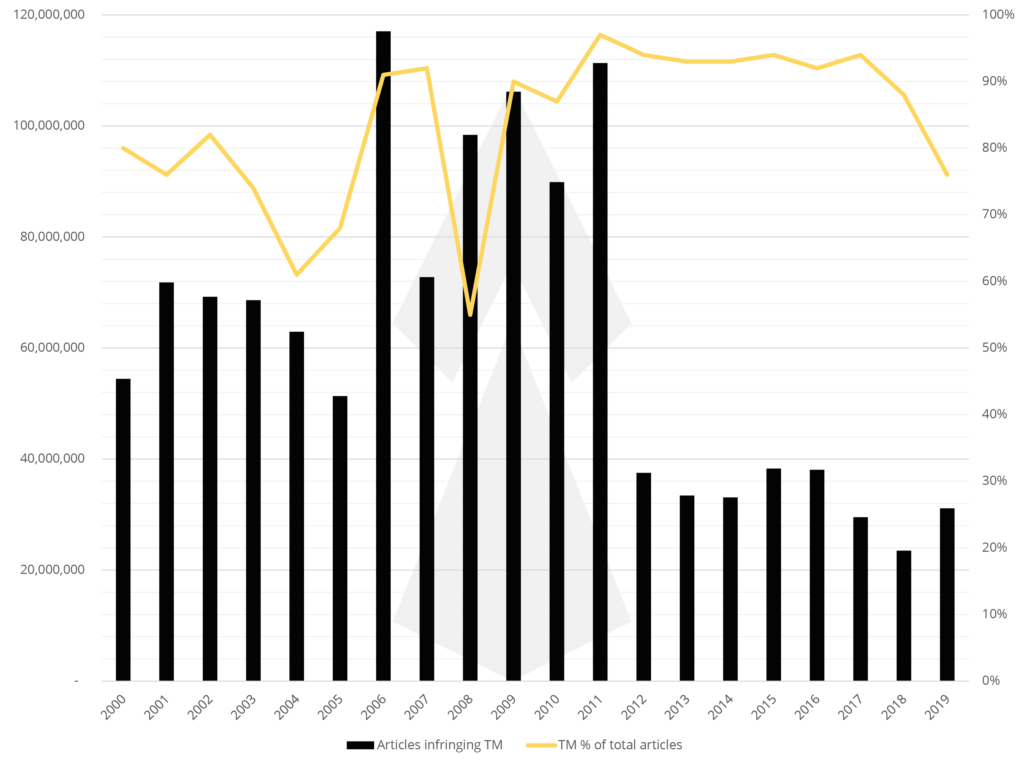
1.7 Trade Mark Infringing Articles & Percentage of Total
This chart represents two metrics. Firstly, on the left y axis, the total number of articles seized on the basis of trade mark infringement. As total articles represents all IPR infringements, this figure is a subset of Chart 1.1. On the right y axis, the percentage of total articles seized on the basis of trade mark infringement is displayed. Since 200, articles seized on the basis of trade mark infringement has fallen by an average of 2.76% per year, from around 54 million in 2000 to around 31 million in 2019. Trade mark infringement remains the single biggest IPR enforced by EU Customs, with an average proportion of 84% over the dataset.
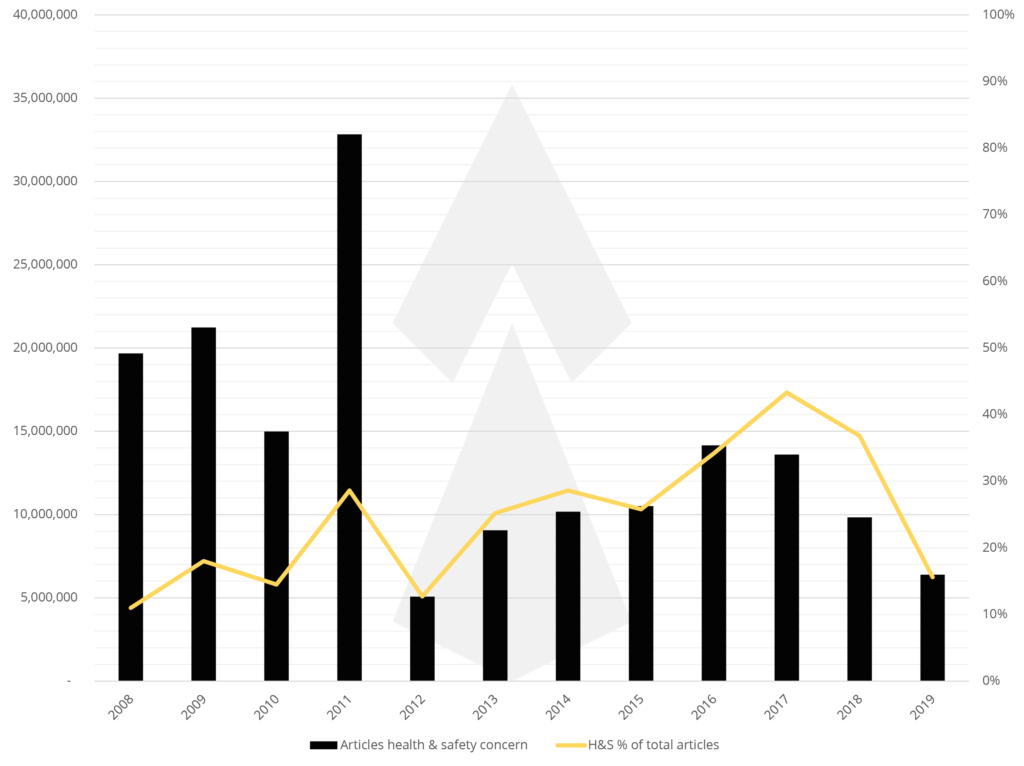
1.8 Health & Safety Risk Articles & Percentage of Total
This chart represents two metrics. Firstly, on the left y axis, the total number of high risk articles seized presenting a health & safety threat. Articles identified as high risk are: foodstuffs (see 2.1); body care (see 2.2); medicines (see 2.11); electrical household goods (see 2.6 & 2.7; and toys (see 2.9).
As total articles represents all product categories, this figure is a subset of Chart 1.1. On the right y axis, the percentage of high risk articles seized is displayed. Since 2000, high risk articles seized has fallen by an average of 8.95% per year, from around 20 million in 2008 to around 6 million in 2019. High risk items presenting a health & safety threat averages 25% of all articles seized.
1.9 Date Table for Section 1
The data used for all Charts in Section 1 is displayed in this table. Please note: “NR” means Not Reported.
| 1999 | 2000 | 2001 | 2002 | 2003 | 2004 | 2005 | 2006 | 2007 | 2008 | 2009 | 2010 | 2011 | 2012 | 2013 | 2014 | 2015 | 2016 | 2017 | 2018 | 2019 | |
| Total articles | 25,285,838 | 67,790,546 | 94,421,497 | 84,951,039 | 92,218,700 | 103,546,179 | 75,733,387 | 128,631,295 | 79,076,458 | 178,908,278 | 117,959,298 | 103,306,928 | 114,772,812 | 39,917,445 | 35,940,294 | 35,569,982 | 40,728,675 | 41,387,132 | 31,410,703 | 26,720,827 | 40,968,254 |
| Number of cases | 4,694 | 6,253 | 5,056 | 7,553 | 10,709 | 22,311 | 26,704 | 37,334 | 43,671 | 49,381 | 43,572 | 79,112 | 91,245 | 90,473 | 86,854 | 95,194 | 81,098 | 63,184 | 57,433 | 69,354 | 91,868 |
| Estimated value | NR | NR | NR | NR | NR | NR | NR | NR | NR | NR | NR | 1,110,052,402 | 1,272,354,795 | 896,891,786 | 768,227,929 | 617,046,337 | 642,108,323 | 672,899,102 | 582,456,067 | 738,125,867 | 759,198,194 |
| Articles per case | 5,387 | 10,841 | 18,675 | 11,247 | 8,611 | 4,641 | 2,836 | 3,445 | 1,811 | 3,623 | 2,707 | 1,306 | 1,258 | 441 | 414 | 374 | 502 | 655 | 547 | 385 | 446 |
| Value per case | NR | NR | NR | NR | NR | NR | NR | NR | NR | NR | NR | 14,031 | 13,944 | 9,913 | 8,845 | 6,482 | 7,918 | 10,650 | 10,141 | 10,643 | 8,264 |
| Value per article | NR | NR | NR | NR | NR | NR | NR | NR | NR | NR | NR | 11 | 11 | 22 | 21 | 17 | 16 | 16 | 19 | 28 | 19 |
| TM % of total articles | NR | 80% | 76% | 82% | 74% | 61% | 68% | 91% | 92% | 55% | 90% | 87% | 97% | 94% | 93% | 93% | 94% | 92% | 94% | 88% | 76% |
| Articles infringing TM | NR | 54,448,184 | 71,809,127 | 69,217,120 | 68,624,104 | 62,930,812 | 51,345,707 | 117,054,478 | 72,750,341 | 98,399,553 | 106,163,368 | 89,877,027 | 111,329,628 | 37,522,398 | 33,424,473 | 33,080,083 | 38,284,955 | 38,076,161 | 29,526,061 | 23,514,328 | 31,135,873 |
| H&S % of total articles | NR | NR | NR | NR | NR | NR | NR | NR | NR | 11% | 18% | 15% | 29% | 13% | 25% | 29% | 26% | 34% | 43% | 37% | 16% |
| Articles health & safety concern | NR | NR | NR | NR | NR | NR | NR | NR | NR | 19,679,911 | 21,232,674 | 14,979,505 | 32,825,024 | 5,069,516 | 9,056,954 | 10,173,015 | 10,507,998 | 14,154,399 | 13,600,834 | 9,833,264 | 6,391,048 |
Section 2 – Product Category Breakdown
Data in this section relate to product category breakdowns. All figures are for total articles seized within the specific product category. Product categorisation has changed considerably from 2000 when data was first reported. Former categories have been mapped to current categorisation. Currently, there are 12 master categories, which feature various sub-categories. Only the master category total is displayed in each chart. Each chart has a data table providing a breakdown of articles seized by each sub-category.
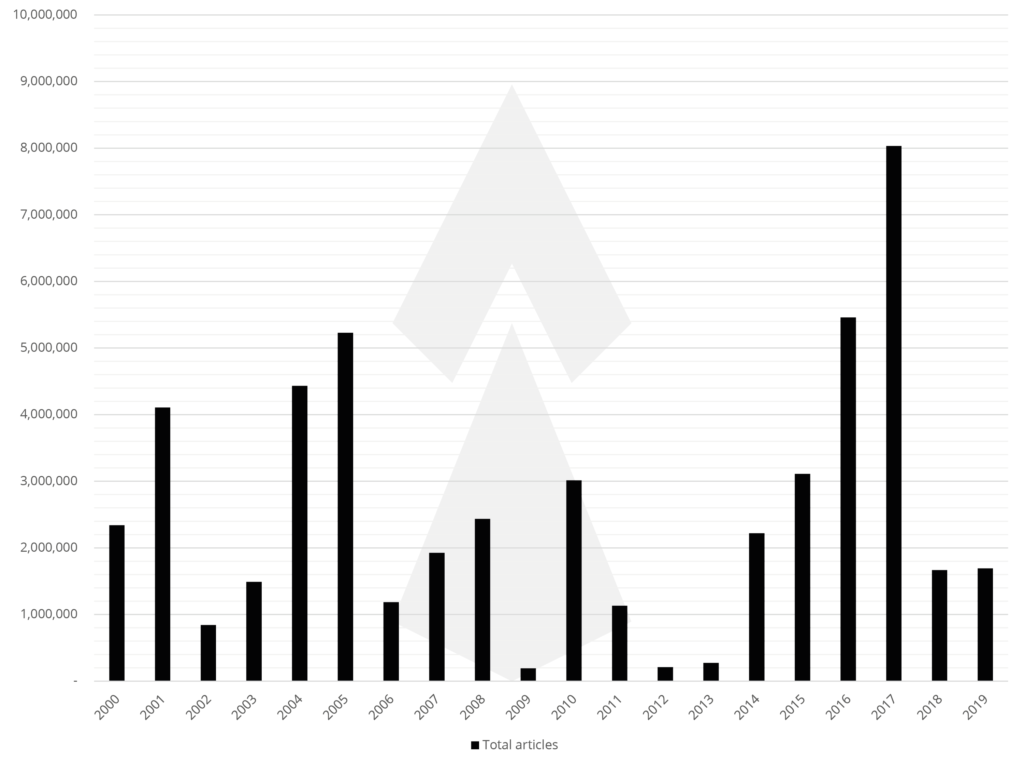
2.1 Foodstuffs, Alcohol, and Other Beverages
2.1.1 Data Table
| 2000 | 2001 | 2002 | 2003 | 2004 | 2005 | 2006 | 2007 | 2008 | 2009 | 2010 | 2011 | 2012 | 2013 | 2014 | 2015 | 2016 | 2017 | 2018 | 2019 | |
| Foodstuffs | 2,340,334 | 4,106,663 | 841,259 | 1,489,908 | 4,432,161 | 5,228,896 | 1,185,649 | 1,924,896 | 2,434,959 | 112,563 | 2,836,803 | 1,053,393 | 84,927 | 161,200 | 1,618,244 | 2,926,390 | 5,317,440 | 7,519,574 | 1,264,781 | 1,387,995 |
| Alcoholic beverage | NR | NR | NR | NR | NR | NR | NR | NR | NR | 12,018 | 129,145 | 74,689 | 37,263 | 59,240 | 148,438 | 30,694 | 52,826 | 415,670 | 46,579 | 86,293 |
| Other beverage | NR | NR | NR | NR | NR | NR | NR | NR | NR | 66,370 | 46,560 | 4,371 | 86,520 | 53,717 | 453,971 | 153,168 | 88,818 | 97,171 | 354,036 | 217,082 |
| Total | 2,340,334 | 4,106,663 | 841,259 | 1,489,908 | 4,432,161 | 5,228,896 | 1,185,649 | 1,924,896 | 2,434,959 | 190,951 | 3,012,508 | 1,132,453 | 208,710 | 274,157 | 2,220,653 | 3,110,252 | 5,459,084 | 8,032,415 | 1,665,396 | 1,691,370 |
2.2 Body Care Items
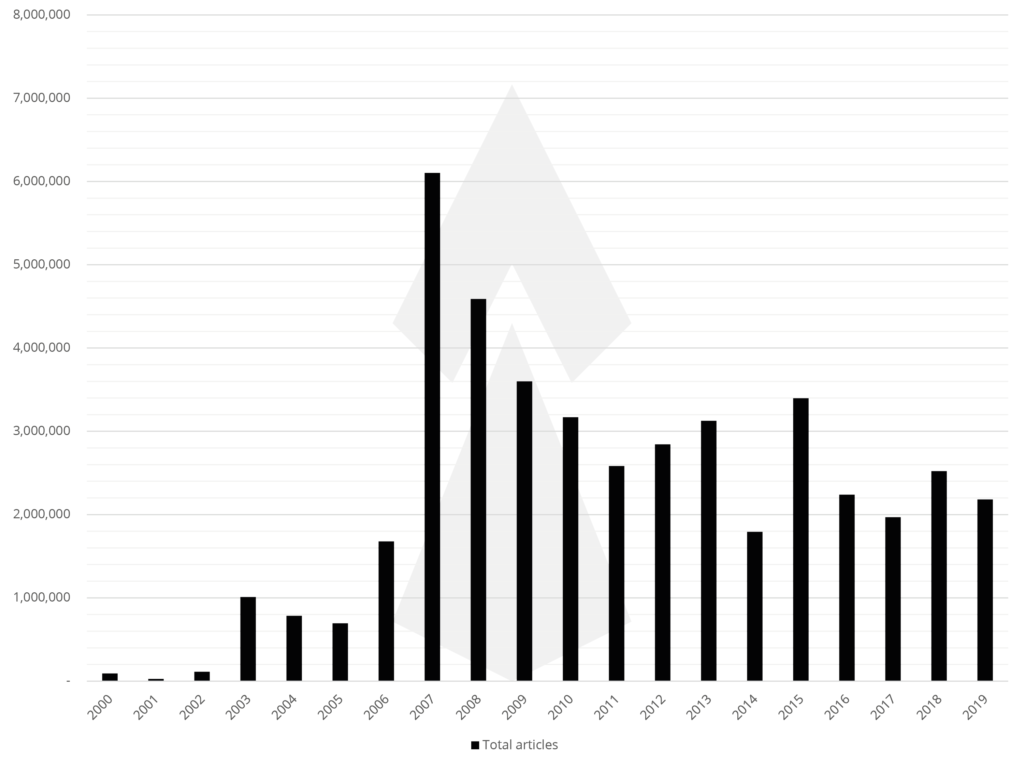
2.2.1 Data Table
| 2000 | 2001 | 2002 | 2003 | 2004 | 2005 | 2006 | 2007 | 2008 | 2009 | 2010 | 2011 | 2012 | 2013 | 2014 | 2015 | 2016 | 2017 | 2018 | 2019 | |
| Perfumes and cosmetics | 92,650 | 26,417 | 112,132 | 1,009,879 | 784,268 | 694,633 | 1,676,409 | 6,103,171 | 4,588,317 | 1,127,728 | 1,219,740 | 748,905 | 1,429,153 | 1,108,537 | 931,907 | 991,175 | 1,037,209 | 377,800 | 1,001,106 | 1,052,627 |
| Other | NR | NR | NR | NR | NR | NR | NR | NR | NR | 2,470,275 | 1,948,341 | 1,834,821 | 1,413,205 | 2,018,190 | 860,711 | 2,404,365 | 1,201,111 | 1,589,879 | 1,520,329 | 1,127,837 |
| Total | 92,650 | 26,417 | 112,132 | 1,009,879 | 784,268 | 694,633 | 1,676,409 | 6,103,171 | 4,588,317 | 3,598,003 | 3,168,081 | 2,583,726 | 2,842,358 | 3,126,727 | 1,792,618 | 3,395,540 | 2,238,320 | 1,967,679 | 2,521,435 | 2,180,464 |
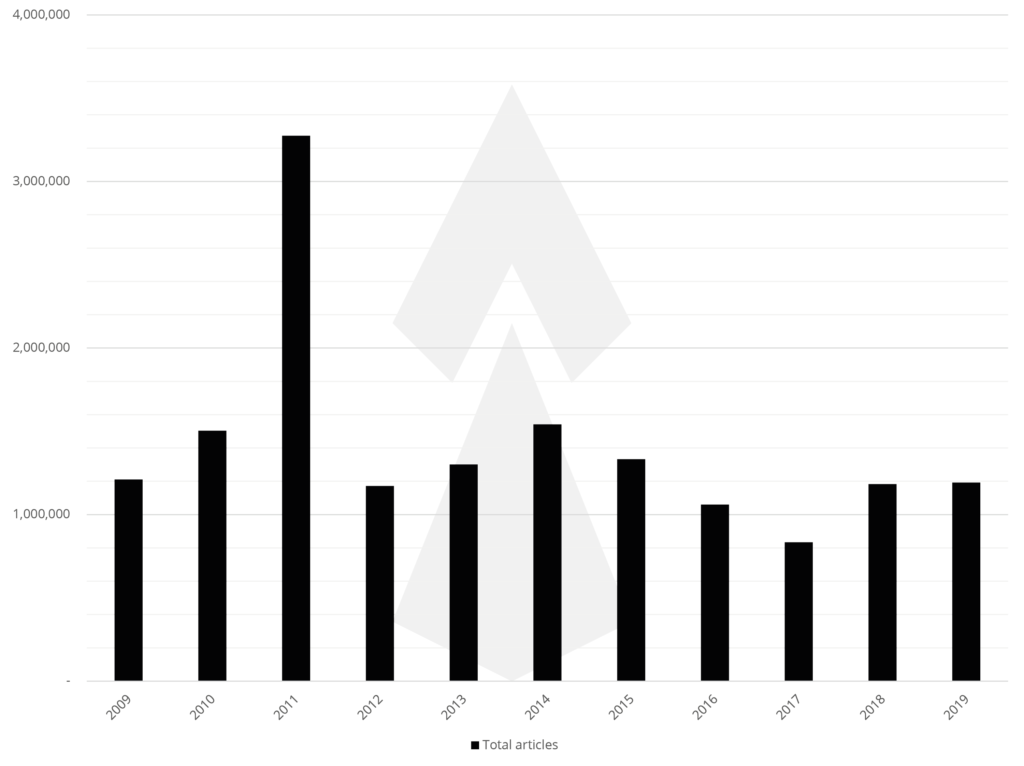
2.3 Clothing & Accessories
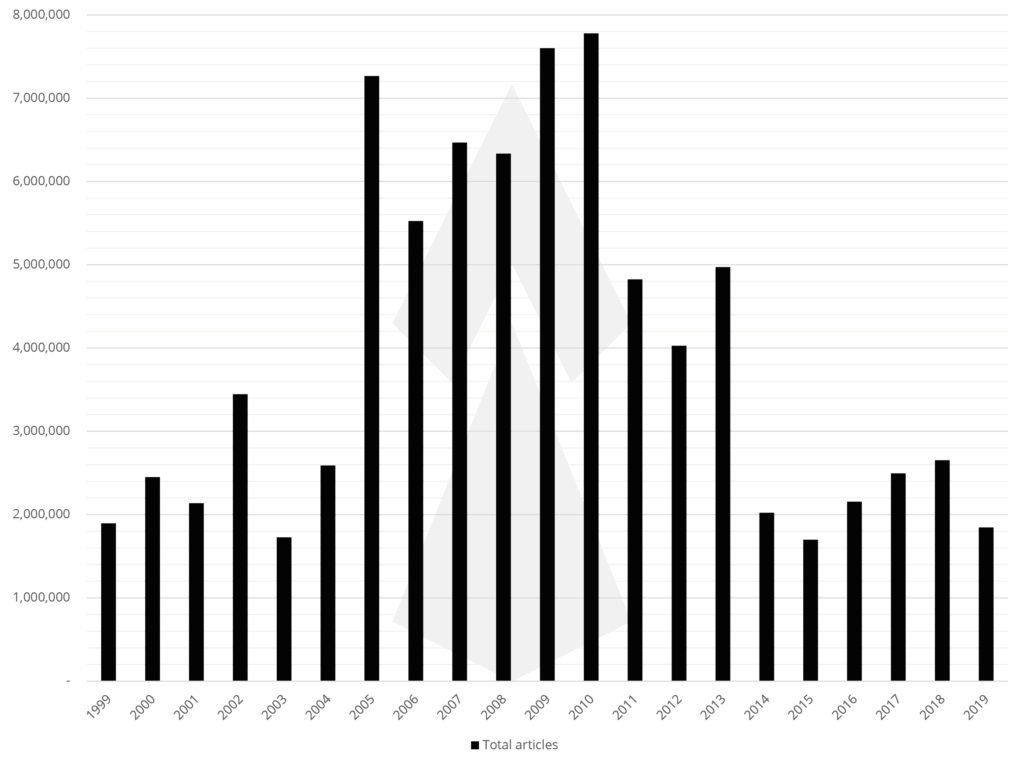
2.3.1 Data Table
| 1999 | 2000 | 2001 | 2002 | 2003 | 2004 | 2005 | 2006 | 2007 | 2008 | 2009 | 2010 | 2011 | 2012 | 2013 | 2014 | 2015 | 2016 | 2017 | 2018 | 2019 | |
| Clothing (ready to wear) | 1,894,490 | 2,449,280 | 2,136,266 | 3,445,835 | 1,727,351 | 2,590,043 | 7,265,530 | 5,525,534 | 6,467,184 | 6,333,913 | 5,955,697 | 6,930,942 | 4,036,781 | 3,398,913 | 4,504,004 | 1,501,883 | 1,200,425 | 1,693,194 | 2,331,558 | 2,305,803 | 1,601,413 |
| Clothing accessroies | NR | NR | NR | NR | NR | NR | NR | NR | NR | NR | 1,644,107 | 847,593 | 787,457 | 628,375 | 467,268 | 520,631 | 497,525 | 460,852 | 162,813 | 346,407 | 243,030 |
| Total | 1,894,490 | 2,449,280 | 2,136,266 | 3,445,835 | 1,727,351 | 2,590,043 | 7,265,530 | 5,525,534 | 6,467,184 | 6,333,913 | 7,599,804 | 7,778,535 | 4,824,238 | 4,027,288 | 4,971,272 | 2,022,514 | 1,697,950 | 2,154,046 | 2,494,371 | 2,652,210 | 1,844,443 |
2.4 Shoes
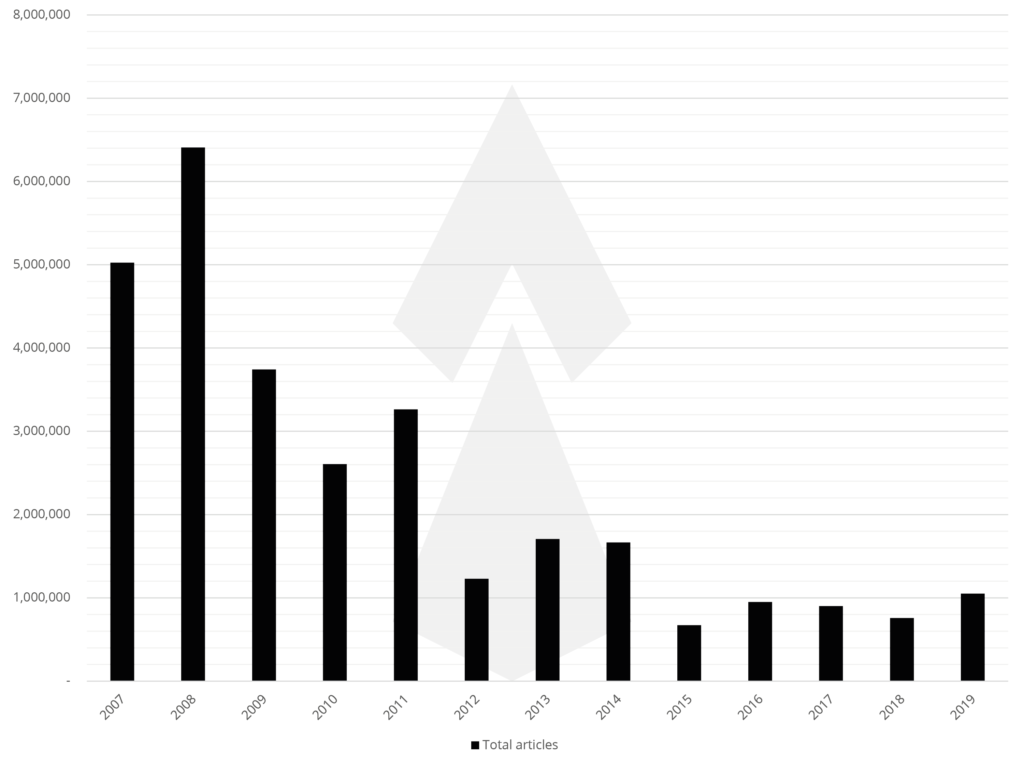
2.4.1 Data Table
| 2007 | 2008 | 2009 | 2010 | 2011 | 2012 | 2013 | 2014 | 2015 | 2016 | 2017 | 2018 | 2019 | |
| Sports shoes | 5,025,304 | 6,408,671 | 1,954,726 | 1,444,230 | 1,147,767 | 466,073 | 591,154 | 459,361 | 356,794 | 531,433 | 580,117 | 480,839 | 601,564 |
| Other shoes | NR | NR | 1,787,053 | 1,160,589 | 2,115,568 | 762,442 | 1,114,433 | 1,205,863 | 314,002 | 419,564 | 321,703 | 275,760 | 449,799 |
| Total | 5,025,304 | 6,408,671 | 3,741,779 | 2,604,819 | 3,263,335 | 1,228,515 | 1,705,587 | 1,665,224 | 670,796 | 950,997 | 901,820 | 756,599 | 1,051,363 |
2.5 Personal Accessories
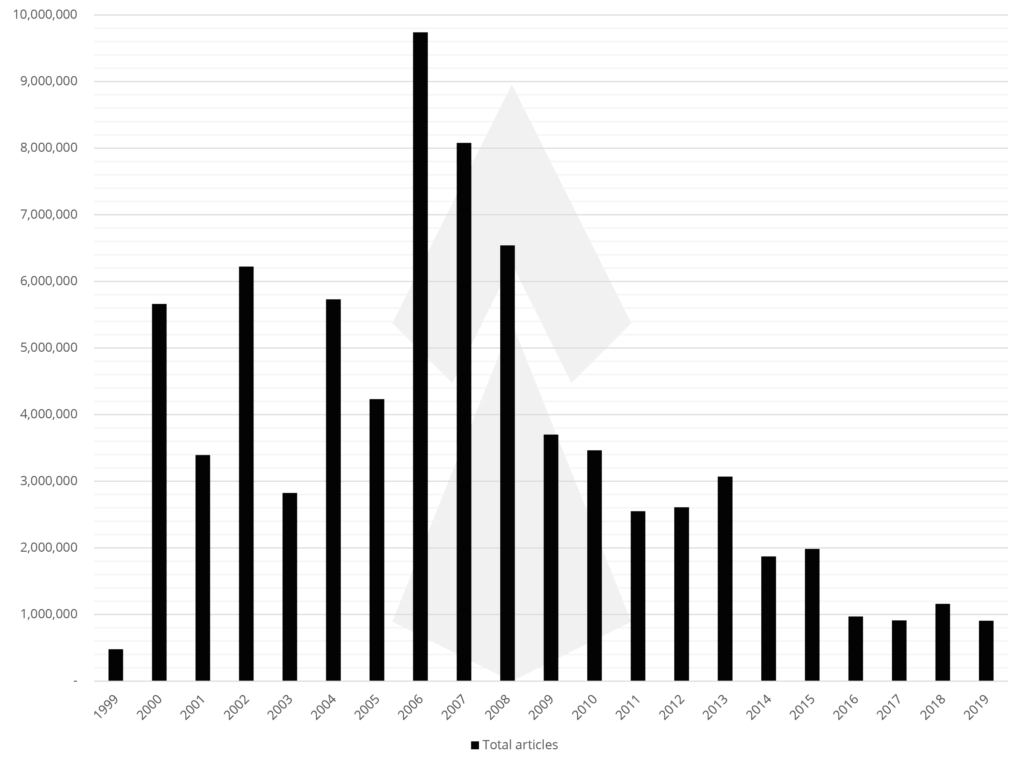
2.5.1 Data Table
| 1999 | 2000 | 2001 | 2002 | 2003 | 2004 | 2005 | 2006 | 2007 | 2008 | 2009 | 2010 | 2011 | 2012 | 2013 | 2014 | 2015 | 2016 | 2017 | 2018 | 2019 | |
| Sunglasses and other eye-glasses | NR | 2,172,901 | 2,646,406 | 5,797,238 | 2,148,921 | 5,237,908 | 3,717,386 | 8,793,123 | 6,290,642 | 4,999,714 | 433,141 | 504,951 | 239,728 | 644,357 | 698,931 | 481,176 | 739,261 | 268,992 | 146,125 | 629,143 | 221,234 |
| Bags, wallets, purses etc | NR | NR | NR | NR | NR | NR | NR | NR | NR | NR | 1,526,342 | 1,388,293 | 968,196 | 885,374 | 817,792 | 496,499 | 767,459 | 279,941 | 417,712 | 340,261 | 412,884 |
| Watches | 478,459 | 3,488,748 | 746,942 | 424,168 | 674,327 | 491,558 | 516,240 | 943,819 | 1,787,016 | 1,539,202 | 305,964 | 313,489 | 452,725 | 471,366 | 324,293 | 182,817 | 198,202 | 198,804 | 207,604 | 91,271 | 116,220 |
| Jewellery and other accessories | NR | NR | NR | NR | NR | NR | NR | NR | NR | NR | 1,435,572 | 1,258,638 | 890,132 | 607,155 | 1,228,919 | 711,782 | 279,210 | 223,149 | 140,267 | 99,035 | 155,722 |
| Total | 478,459 | 5,661,649 | 3,393,348 | 6,221,406 | 2,823,248 | 5,729,466 | 4,233,626 | 9,736,942 | 8,077,658 | 6,538,916 | 3,701,019 | 3,465,371 | 2,550,781 | 2,608,252 | 3,069,935 | 1,872,274 | 1,984,132 | 970,886 | 911,708 | 1,159,710 | 906,060 |
2.6 Mobile Phones
2.6.1 Data Table
| 2009 | 2010 | 2011 | 2012 | 2013 | 2014 | 2015 | 2016 | 2017 | 2018 | 2019 | |
| Mobile phones | 100,116 | 157,352 | 140,265 | 49,609 | 88,484 | 86,236 | 50,086 | 72,268 | 62,939 | 98,057 | 49,678 |
| Parts and technical accessory | 1,110,345 | 1,346,169 | 3,134,535 | 1,122,188 | 1,212,091 | 1,454,783 | 1,282,131 | 987,587 | 770,349 | 1,085,035 | 1,142,622 |
| Total | 1,210,461 | 1,503,521 | 3,274,800 | 1,171,797 | 1,300,575 | 1,541,019 | 1,332,217 | 1,059,855 | 833,288 | 1,183,092 | 1,192,300 |
2.7 Electrical / Electronic & Computer Equipment
2.7.1 Data Table
| 1999 | 2000 | 2001 | 2002 | 2003 | 2004 | 2005 | 2006 | 2007 | 2008 | 2009 | 2010 | 2011 | 2012 | 2013 | 2014 | 2015 | 2016 | 2017 | 2018 | 2019 | |
| Audio/visual apparatus including technical parts | 506,956 | 292,022 | 1,026,517 | 1,763,054 | 523,275 | 4,225,202 | 3,273,538 | 2,984,476 | 3,648,348 | 5,046,607 | 605,824 | 319,910 | 358,371 | 342,277 | 341,744 | 299,977 | 278,523 | 154,637 | 155,160 | 174,854 | 98,126 |
| Memory cards, memory sticks | NR | NR | NR | NR | NR | NR | NR | NR | NR | NR | 214,629 | 387,405 | 166,652 | 168,913 | 145,141 | 153,516 | 115,081 | 92,391 | 65,749 | 73,617 | 36,367 |
| Ink cartridges and toners | NR | NR | NR | NR | NR | NR | NR | NR | NR | NR | 83,133 | 90,226 | 351,510 | 221,206 | 84,050 | 5,817 | 32,782 | 23,161 | 6,944 | 11,498 | 7,794 |
| Computer equipment | NR | 66,115 | 103,327 | 47,184 | 79,402 | 793,149 | 808,637 | 152,102 | 246,236 | 415,144 | 225,602 | 188,448 | 480,225 | 108,420 | 66,511 | 152,244 | 187,093 | 312,427 | 1,433,883 | 260,732 | 299,039 |
| Other equipment (i.e. hair straighter) | NR | NR | NR | NR | NR | NR | NR | NR | NR | NR | 434,450 | 551,749 | 228,288 | 157,399 | 90,852 | 205,450 | 371,908 | 55,414 | 78,762 | 64,384 | 64,521 |
| Total | 506,956 | 358,137 | 1,129,844 | 1,810,238 | 602,677 | 5,018,351 | 4,082,175 | 3,136,578 | 3,894,584 | 5,461,751 | 1,563,638 | 1,537,738 | 1,585,046 | 998,215 | 728,298 | 817,004 | 985,387 | 638,030 | 1,740,498 | 585,085 | 505,847 |
2.8 CD, DVD, Game Cartridges
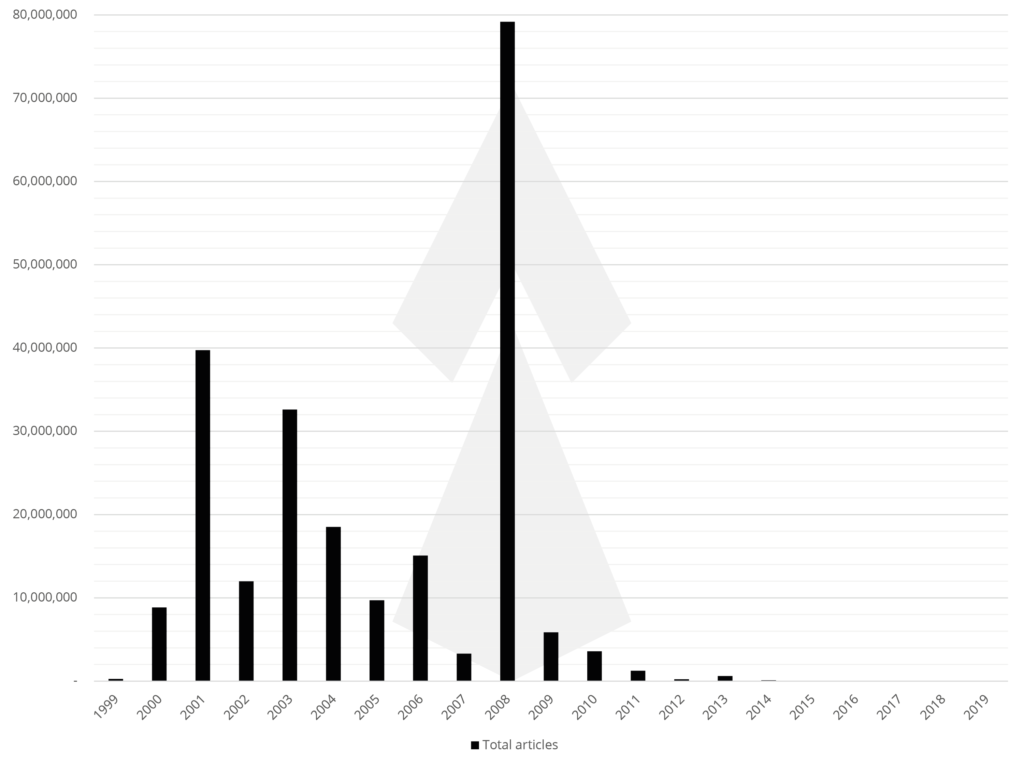
2.8.1 Data Table
| 1999 | 2000 | 2001 | 2002 | 2003 | 2004 | 2005 | 2006 | 2007 | 2008 | 2009 | 2010 | 2011 | 2012 | 2013 | 2014 | 2015 | 2016 | 2017 | 2018 | 2019 | |
| Recorded | 259,220 | 8,842,075 | 39,737,512 | 11,975,237 | 32,616,560 | 18,523,664 | 9,703,059 | 15,080,161 | 3,298,813 | 79,170,506 | 226,618 | 2,733,813 | 493,228 | 52,260 | 265,145 | 66,221 | 27,435 | 19,723 | 11,976 | 3,806 | 29,129 |
| Unrecorded | NR | NR | NR | NR | NR | NR | NR | NR | NR | NR | 5,630,599 | 848,967 | 749,689 | 167,738 | 341,182 | 23,468 | 1,000 | 0 | 0 | 0 | 5 |
| Total | 259,220 | 8,842,075 | 39,737,512 | 11,975,237 | 32,616,560 | 18,523,664 | 9,703,059 | 15,080,161 | 3,298,813 | 79,170,506 | 5,857,217 | 3,582,780 | 1,242,917 | 219,998 | 606,327 | 89,689 | 28,435 | 19,723 | 11,976 | 3,806 | 29,134 |
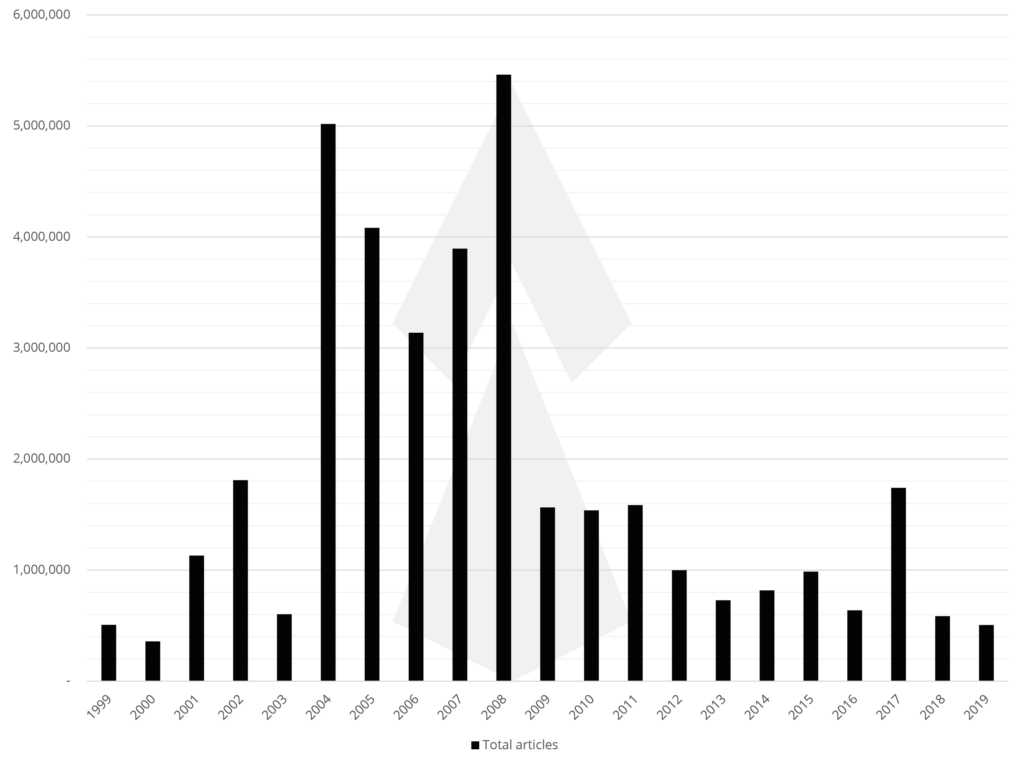
2.9 Toys & Games
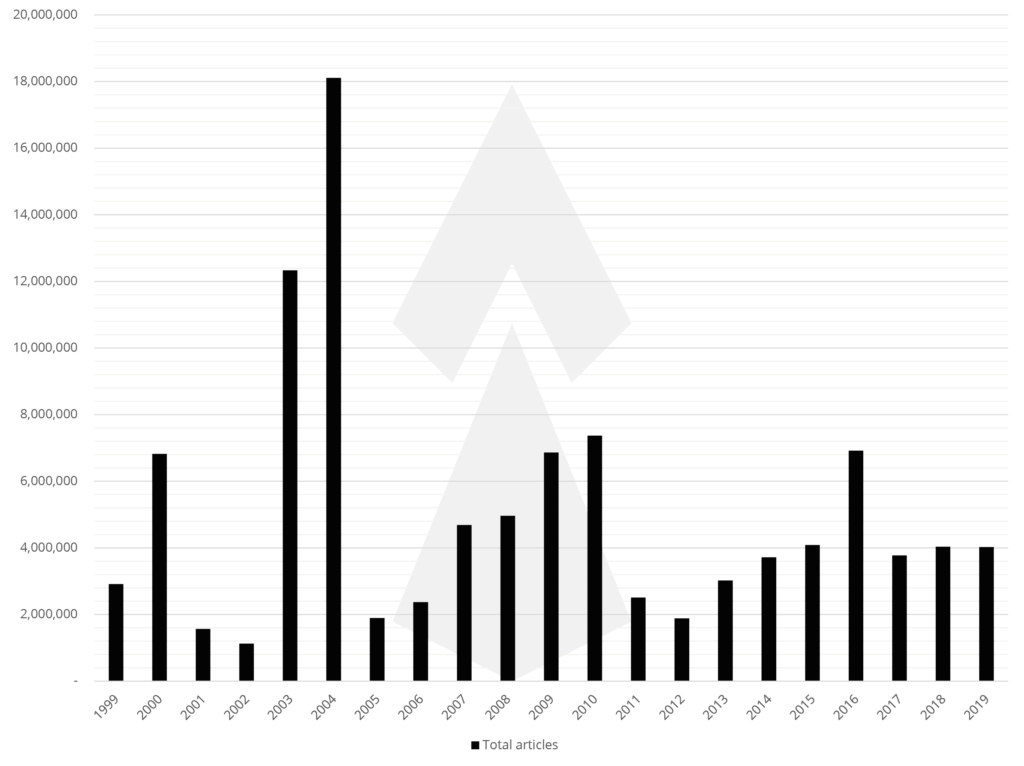
2.9.1 Data Table
| 1999 | 2000 | 2001 | 2002 | 2003 | 2004 | 2005 | 2006 | 2007 | 2008 | 2009 | 2010 | 2011 | 2012 | 2013 | 2014 | 2015 | 2016 | 2017 | 2018 | 2019 | |
| Toys | 2,911,798 | 6,819,113 | 1,565,578 | 1,124,756 | 12,333,868 | 18,106,924 | 1,891,981 | 2,370,894 | 4,685,037 | 4,963,016 | 6,285,265 | 6,737,254 | 2,127,300 | 1,637,941 | 2,788,944 | 3,503,042 | 3,902,258 | 6,850,733 | 3,440,108 | 3,795,087 | 3,940,320 |
| Games | NR | NR | NR | NR | NR | NR | NR | NR | NR | NR | 545,888 | 403,658 | 269,348 | 105,390 | 172,381 | 128,992 | 117,248 | 49,865 | 279,960 | 190,219 | 40,182 |
| Sporting articles | NR | NR | NR | NR | NR | NR | NR | NR | NR | NR | 28,445 | 226,502 | 113,772 | 138,568 | 59,403 | 84,997 | 66,187 | 18,170 | 53,049 | 47,521 | 41,919 |
| Total | 2,911,798 | 6,819,113 | 1,565,578 | 1,124,756 | 12,333,868 | 18,106,924 | 1,891,981 | 2,370,894 | 4,685,037 | 4,963,016 | 6,859,598 | 7,367,414 | 2,510,420 | 1,881,899 | 3,020,728 | 3,717,031 | 4,085,693 | 6,918,768 | 3,773,117 | 4,032,827 | 4,022,421 |
2.10 Tobacco Products
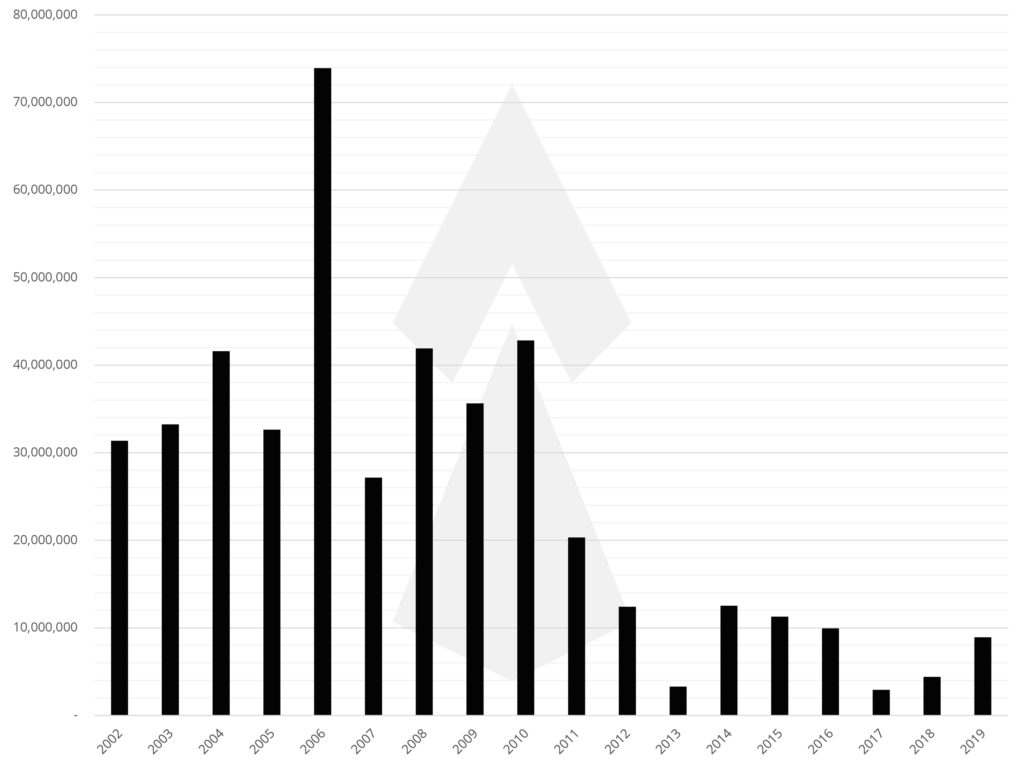
2.10.1 Data Table
| 2002 | 2003 | 2004 | 2005 | 2006 | 2007 | 2008 | 2009 | 2010 | 2011 | 2012 | 2013 | 2014 | 2015 | 2016 | 2017 | 2018 | 2019 | |
| Cigarettes | 31,360,411 | 33,244,507 | 41,588,030 | 32,641,243 | 73,920,446 | 27,161,056 | 41,907,847 | 17,000,368 | 34,646,097 | 20,234,352 | 12,319,444 | 3,269,342 | 12,346,308 | 11,239,956 | 9,911,814 | 2,917,205 | 4,189,219 | 8,737,832 |
| Other (i.e. cigars, paper etc) | NR | NR | NR | NR | NR | NR | NR | 18,632,187 | 8,174,565 | 75,579 | 96,069 | 21,781 | 173,282 | 46,806 | 23,401 | 10,242 | 220,806 | 184,602 |
| Total | 31,360,411 | 33,244,507 | 41,588,030 | 32,641,243 | 73,920,446 | 27,161,056 | 41,907,847 | 35,632,555 | 42,820,662 | 20,309,931 | 12,415,513 | 3,291,123 | 12,519,590 | 11,286,762 | 9,935,215 | 2,927,447 | 4,410,025 | 8,922,434 |
2.11 Medical Products
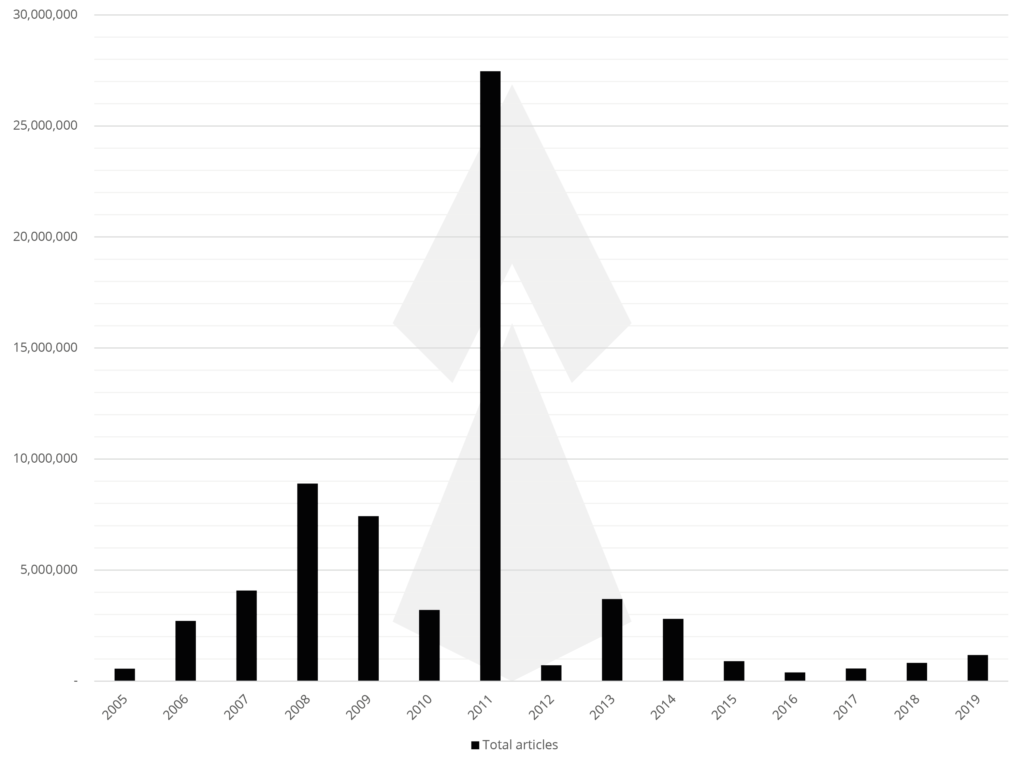
2.11.1 Data Table
| 2005 | 2006 | 2007 | 2008 | 2009 | 2010 | 2011 | 2012 | 2013 | 2014 | 2015 | 2016 | 2017 | 2018 | 2019 | |
| Medicines and other products (condoms) | 560,598 | 2,711,410 | 4,081,056 | 8,891,056 | 7,423,824 | 3,200,492 | 27,460,538 | 712,220 | 3,690,876 | 2,804,569 | 895,324 | 392,037 | 568,122 | 822,399 | 1,172,076 |
| Total | 560,598 | 2,711,410 | 4,081,056 | 8,891,056 | 7,423,824 | 3,200,492 | 27,460,538 | 712,220 | 3,690,876 | 2,804,569 | 895,324 | 392,037 | 568,122 | 822,399 | 1,172,076 |
2.12 Other
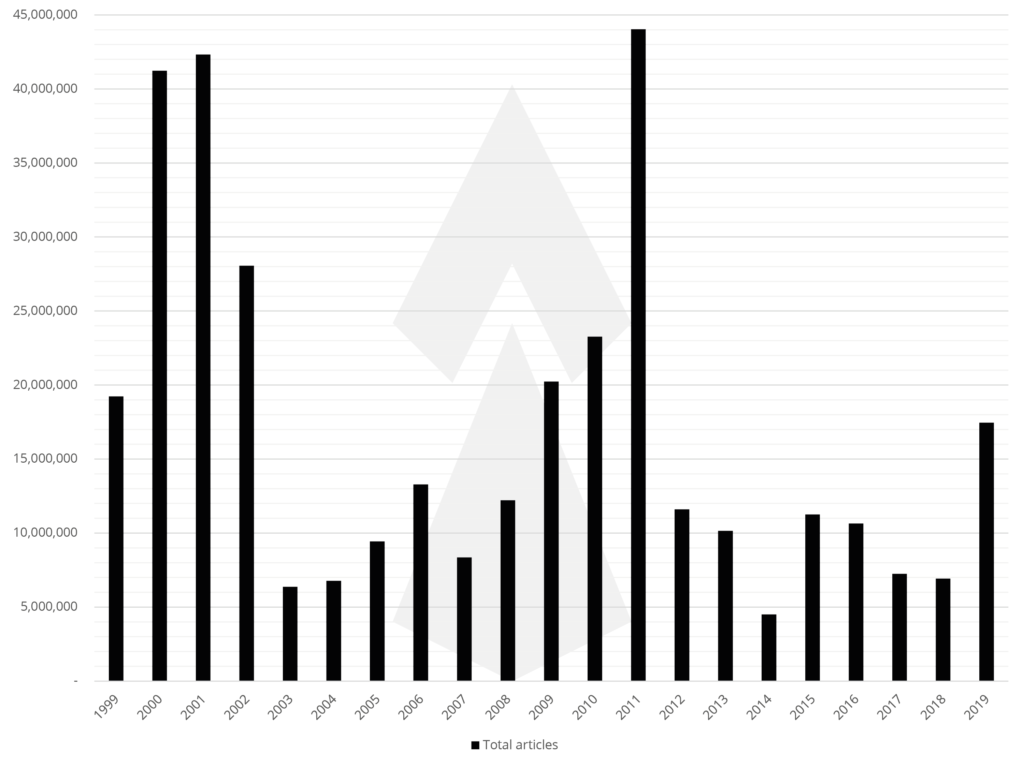
2.12.1 Data Table
| 1999 | 2000 | 2001 | 2002 | 2003 | 2004 | 2005 | 2006 | 2007 | 2008 | 2009 | 2010 | 2011 | 2012 | 2013 | 2014 | 2015 | 2016 | 2017 | 2018 | 2019 | |
| Machines and tools | NR | NR | NR | NR | NR | NR | NR | NR | NR | NR | 10,574 | 16,835 | 79,032 | 236,117 | 98,719 | 179,791 | 155,534 | 94,948 | 51,281 | 161,234 | 474,429 |
| Vehicles including accessories and parts | NR | NR | NR | NR | NR | NR | NR | NR | NR | NR | 50,233 | 104,935 | 428,725 | 183,643 | 341,433 | 157,680 | 382,638 | 155,844 | 422,218 | 451,114 | 472,966 |
| Office stationery | NR | NR | NR | NR | NR | NR | NR | NR | NR | NR | 280,819 | 8,705,155 | 2,269,158 | 244,838 | 1,382,077 | 60,309 | 757,999 | 592,636 | 386,205 | 47,365 | 226,980 |
| Lighters | NR | NR | NR | NR | NR | NR | NR | NR | NR | NR | 546,684 | 1,219,457 | 136,114 | 656,335 | 114,843 | 179,888 | 355,115 | 163,059 | 61,264 | 102,017 | 152,657 |
| Labels, tags, stickers | NR | NR | NR | NR | NR | NR | NR | NR | NR | NR | 15,594,983 | 7,033,905 | 2,515,950 | 1,413,271 | 835,339 | 936,624 | 3,319,198 | 1,259,192 | 1,922,153 | 2,380,535 | 1,030,163 |
| Textiles | NR | NR | NR | NR | NR | NR | NR | NR | NR | NR | 252,200 | 345,920 | 251,376 | 243,659 | 87,188 | 200,645 | 164,600 | 123,274 | 105,192 | 100,278 | 171,409 |
| Packaging materials | NR | NR | NR | NR | NR | NR | NR | NR | NR | NR | 1,073,183 | 3,813,894 | 24,343,992 | 3,929,727 | 3,227,679 | 1,171,156 | 1,878,594 | 4,778,521 | 1,429,350 | 2,615,738 | 5,557,620 |
| Other goods | 19,234,921 | 41,227,308 | 42,325,869 | 28,059,765 | 6,370,702 | 6,773,242 | 9,431,647 | 13,287,274 | 8,357,699 | 12,209,326 | 2,422,754 | 2,024,906 | 14,010,280 | 4,695,090 | 4,067,411 | 1,620,704 | 4,242,512 | 3,482,697 | 2,873,599 | 1,069,962 | 9,364,118 |
| Total | 19,234,921 | 41,227,308 | 42,325,869 | 28,059,765 | 6,370,702 | 6,773,242 | 9,431,647 | 13,287,274 | 8,357,699 | 12,209,326 | 20,231,430 | 23,265,007 | 44,034,627 | 11,602,680 | 10,154,689 | 4,506,797 | 11,256,190 | 10,650,171 | 7,251,262 | 6,928,243 | 17,450,342 |
Section 3 – Transport Breakdown
Data in this section relate to breakdowns by mode of transport. These charts show the transport types used to facilitate the importation of IPR infringing product into the EU.
3.1 Transport Breakdown by Articles Seized
This chart displays transport breakdown by IPR infringing articles seized. It shows the dominance of Sea as the primary mode of transport to import articles into the EU. Since 2004 Sea has always been the single largest transport distribution method, with an average proportion of 69%.
3.1.1 Data Table
| 2004 | 2005 | 2006 | 2007 | 2008 | 2009 | 2010 | 2011 | 2012 | 2013 | 2014 | 2015 | 2016 | 2017 | 2018 | 2019 | |
| Train | 1% | 1% | 1% | 1% | 0% | 0% | 0% | 0% | 0% | 0% | 1% | 0% | 0% | 0% | 0% | 1% |
| Air | 12% | 9% | 7% | 11% | 7% | 17% | 9% | 8% | 19% | 22% | 17% | 17% | 16% | 23% | 23% | 9% |
| Sea | 69% | 77% | 76% | 58% | 81% | 75% | 82% | 68% | 59% | 63% | 70% | 74% | 67% | 64% | 54% | 71% |
| Post | 0% | 1% | 1% | 1% | 0% | 1% | 1% | 2% | 3% | 3% | 2% | 2% | 2% | 3% | 2% | 1% |
| Road | 15% | 11% | 15% | 28% | 12% | 6% | 8% | 22% | 19% | 12% | 10% | 7% | 14% | 10% | 20% | 16% |
| Inland waterway | NR | NR | NR | NR | NR | NR | NR | NR | NR | NR | NR | NR | NR | NR | NR | 1% |
3.2 Transport Breakdown by Number of Cases
This chart displays transport breakdown by number of cases. It shows the comparatively small number of cases from Sea, even though Sea is the distribution method where most articles are seized. This chart also show the growing contribution of Post, notably caused by increase in ecommerce and the use of small parcels. This shows that the trade in IPR infringing products is increasingly more decentralised. Since 2011 Post has increased by an average of 10% per year and has since 2010 been the single largest contributor to the total number of cases.
3.2.1 Data Table
| 2001 | 2002 | 2003 | 2004 | 2005 | 2006 | 2007 | 2008 | 2009 | 2010 | 2011 | 2012 | 2013 | 2014 | 2015 | 2016 | 2017 | 2018 | 2019 | |
| Train | 0% | 1% | 0% | 1% | 1% | 1% | 53% | 1% | 0% | 0% | 0% | 0% | 0% | 0% | 0% | 0% | 0% | 0% | 0% |
| Air | 60% | 45.5% | 50% | 48% | 51% | 53% | 1% | 44% | 44% | 26% | 28% | 27% | 26% | 18% | 25% | 31% | 31% | 29% | 34% |
| Sea | 16% | 13% | 12% | 11% | 13% | 8% | 8% | 9% | 9% | 5% | 4% | 4% | 4% | 3% | 3% | 3% | 3% | 2% | 2% |
| Post | 11% | 33% | 30% | 32% | 25% | 23% | 20% | 24% | 34% | 62% | 63% | 62% | 64% | 77% | 71% | 65% | 65% | 67% | 63% |
| Road | 13% | 8% | 8% | 7% | 9% | 12% | 17% | 21% | 13% | 7% | 5% | 7% | 6% | 2% | 1% | 1% | 1% | 2% | 1% |
| Inland waterway | NR | NR | NR | NR | NR | NR | NR | NR | NR | NR | NR | NR | NR | NR | NR | NR | NR | NR | 0% |
3.3 Transport Breakdown by Estimated Retail Value
This chart displays transport breakdown by estimated retail value. It shows the declining dominance of Sea as the primary mode of transport to import articles into the EU, in favour of Air and Post. Whilst Sea has fallen on average 3% per year, Air has increased by an average of 4% and Post by 17% each year.
3.3.1 Data Table
| 2001 | 2002 | 2003 | 2004 | 2005 | 2006 | 2007 | 2008 | 2009 | 2010 | 2011 | 2012 | 2013 | 2014 | 2015 | 2016 | 2017 | 2018 | 2019 | |
| Train | NR | NR | NR | NR | NR | NR | NR | NR | NR | 0% | 1% | 0% | 0% | 0% | 0% | 0% | 0% | 0% | 1% |
| Air | NR | NR | NR | NR | NR | NR | NR | NR | NR | 21% | 22% | 20% | 22% | 26% | 32% | 36% | 42% | 26% | 30% |
| Sea | NR | NR | NR | NR | NR | NR | NR | NR | NR | 66% | 64% | 56% | 63% | 51% | 51% | 55% | 35% | 53% | 51% |
| Post | NR | NR | NR | NR | NR | NR | NR | NR | NR | 3% | 5% | 12% | 3% | 8% | 9% | 7% | 17% | 10% | 14% |
| Road | NR | NR | NR | NR | NR | NR | NR | NR | NR | 10% | 8% | 12% | 12% | 15% | 8% | 2% | 5% | 10% | 4% |
| Inland waterway | NR | NR | NR | NR | NR | NR | NR | NR | NR | NR | NR | NR | NR | NR | NR | NR | NR | NR | 0% |
Section 4 – Breakdown of Articles Seized by Member States Breakdown
This data table shows the breakdown of articles seized by each Member State. The Not Reported entries are due to the countries not being a Member State. The top 5 Member States reporting the highest articles seized since 1999 are: the Netherlands; Italy; Belgium; Germany; and Greece. The top 5 Member States account for 61% of all EU customs seizures. The bottom 5 Member States: Croatia; Slovakia; Ireland; Luxembourg; and Estonia account for less than 1% of the total.
| 1999 | 2000 | 2001 | 2002 | 2003 | 2004 | 2005 | 2006 | 2007 | 2008 | 2009 | 2010 | 2011 | 2012 | 2013 | 2014 | 2015 | 2016 | 2017 | 2018 | 2019 | |
| Austria | 260,858 | 299,718 | 110,699 | 354,352 | 499,258 | 4,107,988 | 179,683 | 166,546 | 104,608 | 619,897 | 562,091 | 292,606 | 97,957 | 182,046 | 98,440 | 195,650 | 44,832 | 77,741 | 235,725 | 38,513 | 370,240 |
| Belgium | 1,073,416 | 14,578,368 | 16,938,752 | 17,579,272 | 55,030,118 | 20,395,907 | 18,956,750 | 18,744,113 | 4,942,716 | 6,580,898 | 2,827,367 | 1,776,855 | 4,297,806 | 2,310,620 | 2,108,855 | 6,614,925 | 504,130 | 4,287,417 | 966,155 | 1,307,944 | 595,705 |
| Bulgaria | NA | NA | NA | NA | NA | NA | NA | NA | 7,759,759 | 5,500,154 | 11,335,030 | 4,444,533 | 32,593,339 | 2,019,180 | 562,579 | 635,706 | 1,282,130 | 638,248 | 1,109,979 | 1,531,696 | 2,924,055 |
| Croatia | NA | NA | NA | NA | NA | NA | NA | NA | NA | NA | NA | NA | NA | NA | 59,324 | 122,794 | 306,000 | 744,099 | 62,715 | 2,078,311 | 250,377 |
| Cyprus | NA | NA | NA | NA | NA | 157,690 | 187,894 | 237,810 | 90,778 | 161,779 | 1,091,401 | 88,985 | 170,914 | 392,891 | 339,856 | 37,823 | 35,661 | 243,018 | 11,607 | 13,858 | 683,168 |
| Czech Republic | NA | NA | NA | NA | NA | 934,348 | 770,729 | 985,586 | 1,040,861 | 1,021,397 | 2,072,559 | 1,451,993 | 1,861,910 | 662,429 | 1,014,152 | 602,751 | 515,105 | 4,621,189 | 354,136 | 209,317 | 4,182,292 |
| Denmark | 18,776 | 383,829 | 1,308,315 | 157,410 | 42,842 | 64,681 | 212,615 | 90,634 | 192,721 | 9,064,420 | 1,896,944 | 100,501 | 518,006 | 64,296 | 42,393 | 32,660 | 51,021 | 1,101,242 | 17,279 | 27,633 | 553,316 |
| Estonia | NA | NA | NA | NA | NA | 236,323 | 210,495 | 97,698 | 53,007 | 99,953 | 186,063 | 617,538 | 355,382 | 119,962 | 4,576 | 76,395 | 25,536 | 177,227 | 68,550 | 50,822 | 532,898 |
| Finland | 4,725,798 | 4,537,375 | 804,712 | 3,545,265 | 1,607,802 | 705,615 | 1,652,647 | 426,925 | 1,846,606 | 1,291,877 | 728,935 | 382,481 | 549,832 | 279,603 | 200,917 | 113,721 | 4,805 | 18,191 | 415,728 | 5,377 | 161 |
| France | 3,826,287 | 3,515,231 | 5,079,378 | 2,143,035 | 1,134,897 | 1,828,021 | 695,240 | 1,858,433 | 2,995,331 | 7,424,102 | 7,936,111 | 6,514,801 | 4,923,690 | 1,180,438 | 2,918,879 | 4,512,382 | 6,331,378 | 1,960,705 | 4,265,443 | 2,087,423 | 1,643,560 |
| Germany | 6,449,636 | 17,832,139 | 17,835,441 | 5,951,247 | 13,889,111 | 15,038,436 | 15,463,216 | 17,129,083 | 11,194,464 | 27,854,300 | 5,012,847 | 2,378,815 | 2,277,714 | 2,470,331 | 3,005,883 | 3,239,347 | 2,302,444 | 3,386,892 | 2,959,079 | 4,704,079 | 3,416,121 |
| Greece | 23,479 | 5,332,532 | 6,371,822 | 2,964,064 | 1,060,878 | 152,045 | 2,599,692 | 25,844,516 | 4,822,319 | 3,637,257 | 21,990,722 | 22,353,823 | 9,665,763 | 941,337 | 679,797 | 728,784 | 6,375,856 | 2,966,330 | 2,517,133 | 2,646,850 | 1,388,284 |
| Hungary | NA | NA | NA | NA | NA | 4,516,845 | 1,338,888 | 1,323,122 | 718,694 | 1,515,614 | 1,211,346 | 551,751 | 335,112 | 1,638,059 | 2,378,875 | 133,323 | 18,130 | 74,204 | 68,283 | 1,460,425 | 530,114 |
| Ireland | 21,650 | 13,064 | 82,283 | 91,206 | 93,233 | 633,994 | 622,120 | 18,785 | 30,502 | 280,404 | 462,993 | 66,853 | 146,472 | 142,110 | 162,298 | 26,126 | 18,001 | 12,826 | 12,746 | 19,081 | 45,628 |
| Italy | 4,811,647 | 2,275,581 | 3,850,125 | 35,779,167 | 7,695,209 | 22,133,872 | 11,601,890 | 18,056,248 | 17,457,211 | 9,003,313 | 12,955,023 | 15,900,422 | 29,908,415 | 6,108,760 | 4,968,196 | 1,333,441 | 2,096,910 | 1,006,661 | 593,487 | 1,077,920 | 1,881,712 |
| Latvia | NA | NA | NA | NA | NA | 167,014 | 159,821 | 184,557 | 781,788 | 80,080 | 724,943 | 120,935 | 1,338,225 | 986,774 | 600,939 | 85,647 | 89,976 | 64,432 | 208,397 | 122,859 | 76,497 |
| Lithuania | NA | NA | NA | NA | NA | 522,983 | 183,998 | 620,428 | 261,968 | 495,846 | 637,194 | 757,990 | 192,715 | 137,555 | 59,029 | 32,604 | 90,618 | 4,905,936 | 6,188,110 | 384,946 | 603,953 |
| Luxembourg | 1,739 | 83,256 | 86,510 | 109,386 | 163,610 | 412,908 | 121,883 | 52,105 | 32,354 | 12,815 | 36,925 | 44,606 | 59,953 | 1,282,134 | 67,348 | 25,164 | 33,622 | 67,379 | 71,957 | 163,326 | 15,590 |
| Malta | NA | NA | NA | NA | NA | 2,632,397 | 2,180,634 | 2,711,435 | 2,438,021 | 3,220,348 | 9,984,712 | 2,650,692 | 4,568,054 | 6,065,155 | 1,762,275 | 5,238,065 | 1,256,131 | 2,604,260 | 1,492,018 | 2,434,450 | 6,134,074 |
| Netherlands | 2,282,827 | 10,396,875 | 34,502,462 | 5,920,768 | 3,258,120 | 8,911,977 | 5,050,444 | 6,949,844 | 4,401,093 | 65,336,872 | 17,965,045 | 96,225,526 | 5,086,932 | 1,966,380 | 2,275,770 | 2,361,330 | 5,120,665 | 2,202,371 | 1,929,071 | 401,707 | 1,979,183 |
| Poland | NA | NA | NA | NA | NA | 773,081 | 2,635,002 | 2,589,343 | 6,134,572 | 3,042,146 | 716,467 | 590,806 | 615,621 | 279,054 | 2,472,723 | 555,638 | 1,074,941 | 383,615 | 1,193,057 | 204,829 | 670,822 |
| Portugal | 768 | 24,676 | 39,929 | 2,063,750 | 250,105 | 222,162 | 544,669 | 494,834 | 495,087 | 507,607 | 195,376 | 9,276,661 | 1,961,746 | 279,132 | 857,647 | 1,312,390 | 352,405 | 855,617 | 126,594 | 246,251 | 309,299 |
| Romania | NA | NA | NA | NA | NA | NA | NA | NA | 3,766,515 | 2,731,117 | 7,728,945 | 3,303,353 | 1,339,058 | 2,078,122 | 1,711,152 | 3,076,236 | 4,693,180 | 3,660,196 | 3,035,707 | 1,945,016 | 9,895,418 |
| Slovakia | NA | NA | NA | NA | NA | 934,348 | 30,562 | 97,733 | 920,701 | 24,387 | 85,122 | 17,966 | 175,257 | 235,579 | 198,340 | 98,895 | 90,103 | 84,546 | 79,124 | 24,279 | 322,053 |
| Slovenia | NA | NA | NA | NA | NA | 942,143 | 1,976,491 | 22,416,958 | 280,630 | 179,955 | 1,120,178 | 1,589,227 | 1,520,522 | 870,246 | 435,556 | 505,975 | 3,213,513 | 1,289,689 | 197,011 | 722,437 | 326,095 |
| Spain | 1,249,482 | 7,596,111 | 6,877,487 | 6,914,478 | 5,575,529 | 8,757,546 | 5,520,996 | 3,388,100 | 2,320,140 | 26,572,996 | 4,368,692 | 12,391,430 | 5,490,037 | 3,140,772 | 3,522,272 | 1,619,264 | 1,893,019 | 1,737,103 | 1,776,405 | 1,305,972 | 563,145 |
| Sweden | 18,580 | 64,019 | 67,155 | 198,788 | 374,035 | 125,520 | 284,032 | 78,054 | 1,141,771 | 489,560 | 418,327 | 75,596 | 68,926 | 51,980 | 102,920 | 20,066 | 58,246 | 211,410 | 30,650 | 23,142 | 75,270 |
| United Kingdom | 520,895 | 857,772 | 466,427 | 623,433 | 1,543,953 | 5,639,630 | 2,555,896 | 4,068,406 | 2,852,244 | 2,159,184 | 3,707,940 | 5,940,183 | 4,653,454 | 4,032,550 | 3,329,303 | 2,231,880 | 2,850,004 | 2,004,588 | 1,424,557 | 1,482,250 | 999,224 |
Sources:
Report on the EU customs enforcement of intellectual property rights 2000-2019 released by the Directorate-General for Taxation and Customs Union – a Directorate-General of the European Commission
Click here to access all publicly available reports via Dropbox.