The data for the charts and tables are collated from official US customs seizure data released annually by the US Customs and Border Protection Office of Trade (CBP). CBP is the largest federal law enforcement agency of Homeland Security, responsible for enforcing customs regulations. Data provided by CBP on customs seizures infringing intellectual property rights has changed significantly from when first made available in 2003. Originally, only a few charts and tables were provided, but since 2009 CBP has compiled a yearly comprehensive report, including trends and observations. The annual report covers the previous financial year. Some early reports included comparison charts from previous years enabling the dataset to be extended back beyond 2003 to 1999 in some instances. As the report developed, the datapoints reported changed, with some additional information incorporated, unfortunately previously reported datapoints were dropped from the report. This increases the difficulty in drawing long-term trends from the data. We have collated, cleansed, and processed the data for you, with a selection of important datapoints visualised below.
Note 1: any record listed as “NR” means Not Reported. This covered data not included for various reasons and which could not be accurately calculated using other datapoints.
See here for customs seizure data covering ?? European Union & ? World Customs Organization
Contents

Section 1 – US Customs Seizure Totals
1.1 Number of Seizures
1.2 Manufacturer’s Suggested Retail Price (MSRP)
1.3 Domestic Value
1.4 Health & Safety Risk Seizures & Percentage of Total
1.5 Date Table for Section 1
Section 2 – Transport Breakdown
2.1 Transport Breakdown by Number of Seizures
Section 3 – Product Category Breakdown
3.1 Product Category Breakdown by MSRP
3.2 Product Category Breakdown by Domestic Value
Sources
Section 1 – US Customs Seizure Totals
Data in this section relate to headline seizure figures covering: number of seizures for IPR infringement; estimated Manufacturer’s Suggested Retail Price (MSRP) of seizures, estimated domestic value of seizures; and the number of high risk articles seized presenting a health & safety concern to the public along with the percentage of total IPR violations relating to such high risk articles.
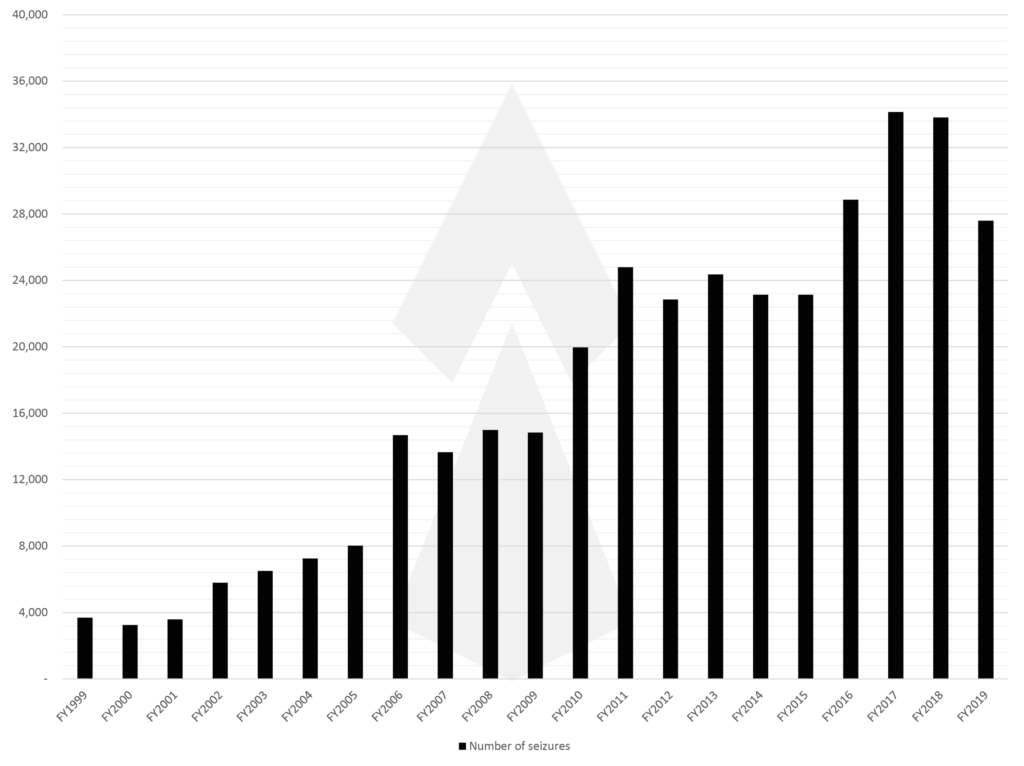
1.1 Number of Seizures
Number of seizures represents the cases opened by US Customs to investigate suspected IPR infringement. A case may cover a single package sent via postal services or a container full of infringing articles. As such, total articles is a better reflection of the scale of IPR infringing goods seized by US Customs. However, the CBP fails to provide a breakdown by number of infringing articles. Since FY 1999, the number of seizures has grown by an average of 10.05% per year, from around 3.7k cases in FY 1999 to almost almost 27.6k cases in FY 2019.
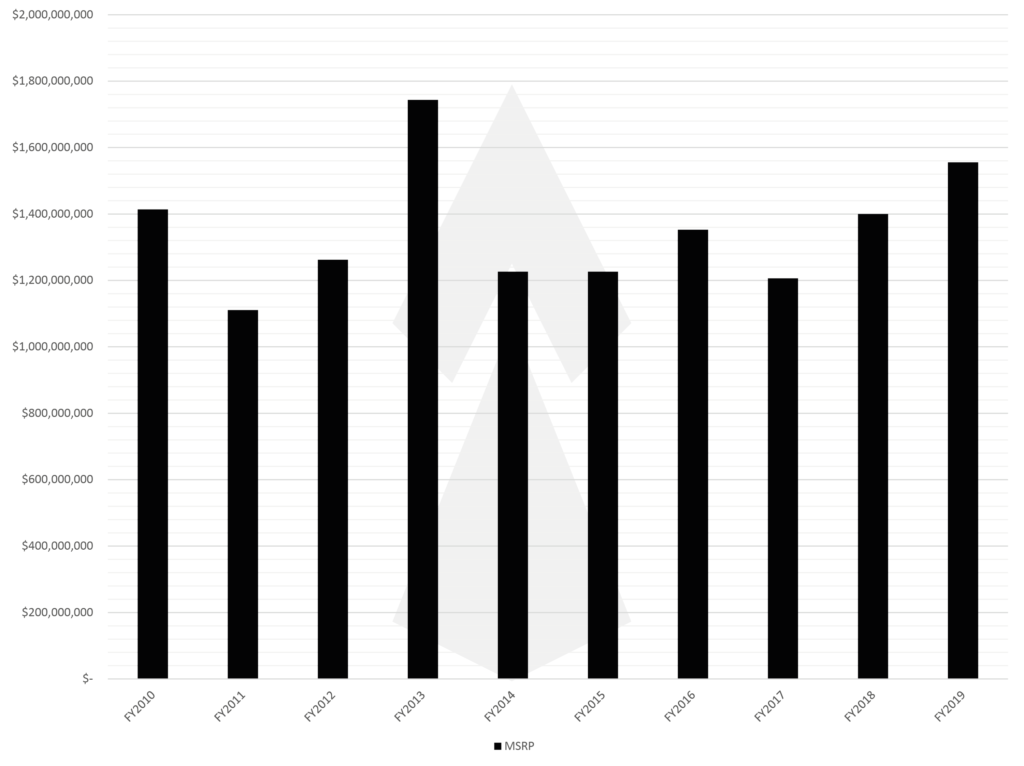
1.2 Manufacturer’s Suggested Retail Price (MSRP)
Homeland Security has used two methods for calculating value. Both methods have specific legal and procedural applications, depending on the enforcement or reporting circumstances. MSRP is recognised as the price at which the product is sold by retail to the consumer or what the value of the infringing products would have been at retail had they been genuine. Furthermore, this figure is calculated without being corrected for inflation. MSRP on seizures is used to determine prosecution thresholds and by Courts to determine sentencing. Whilst MSRP provides a precise figure for legal purposes, it fails to properly account for products without a retail value i.e. labels and tag category. Thus MSRP is not a reliable indicator of long-term trends in seizures in volume or scale.
Currently, only MSRP is reported, with figures first available from FY 2010 onwards. Since 2010, MSRP has grown by an average of 0.96% per year, from around $1.4 billion in FY 2010 to around $1.55 billion in FY 2019.
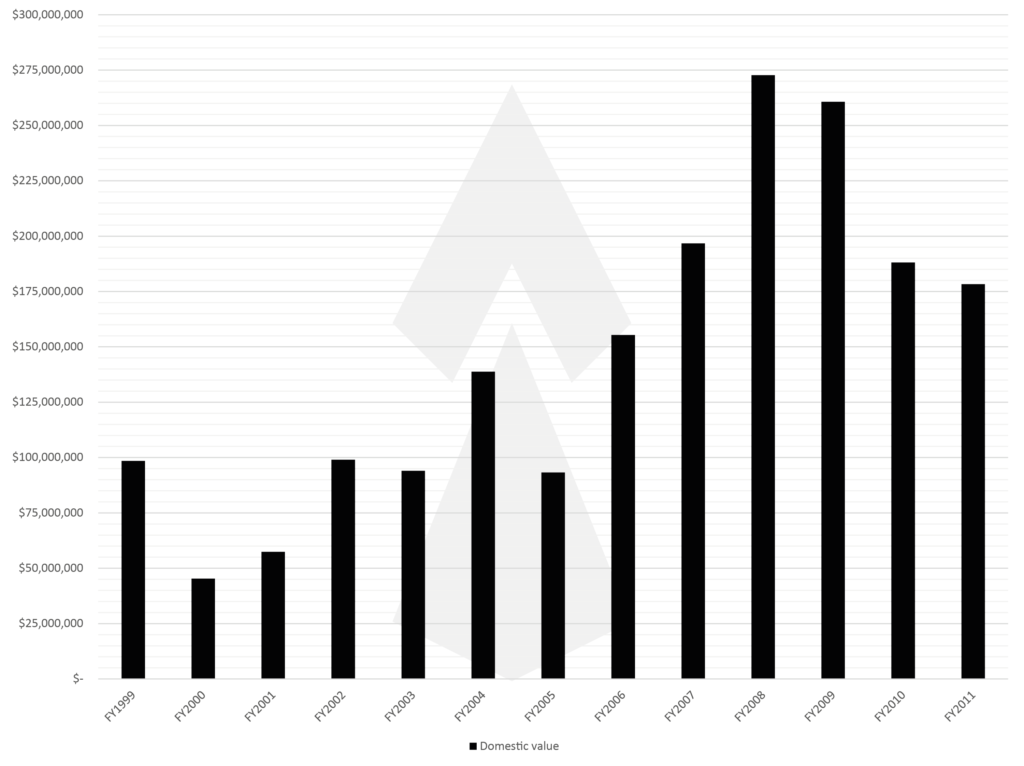
1.3 Domestic Value
Homeland Security has used two methods for calculating value. Both methods have specific legal and procedural applications, depending on the enforcement or reporting circumstances. Domestic value represents the cost of the merchandise when last purchased, plus all duties, fees, broker’s charges, profit, unloading charges, and US freight charges. Domestic value is describe by CBP as the approximate price at which the products will be offered for sale at the first commercial level after importation. As with MSRP, this figure is not a reliable indicator of long-term trens in seizures in volume or scale.
Domestic value was discontinued from FY 2012 onwards. Since 1999, domestic value grew by an average of 4.67% per year until FY 2011 when the figure was last reported. Domestic value grew from around $98.5 million in FY 1999 to just around $178 million in FY 2011.
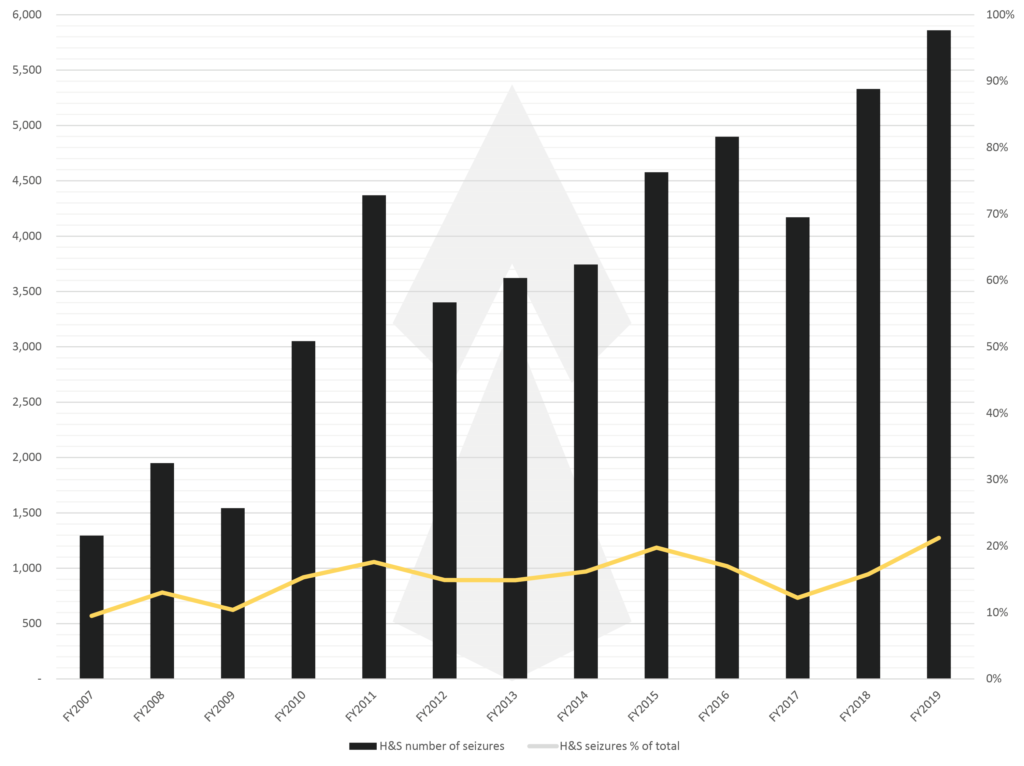
1.4 Health & Safety Risk Seizures & Percentage of Total
This chart represents two metrics. Firstly, on the left y axis, the total number of high risk articles seized presenting a health & safety threat. Product categories identified as high risk have included: automotive / aerospace; batteries; cigarettes; consumer electronics; critical components; personal care; pharmaceuticals; sporting goods (guns); sunglasses.
This figure is a subset of total number of seizures shown in Chart 1.1. On the right y axis, the percentage of high risk products seized is displayed. Since FY 2007, high risk articles seized has grown by an average of 12.31% per year, from around 1.3k seizures in FY 2007 to around 5.8k in FY 2019. High risk seizures presenting a health & safety threat averages 15% of all seizures.
1.5 Date Table for Section 1
The data used for all Charts in Section 1 is displayed in this table. Please note: “NR” means Not Reported.
| FY1999 | FY2000 | FY2001 | FY2002 | FY2003 | FY2004 | FY2005 | FY2006 | FY2007 | FY2008 | FY2009 | FY2010 | FY2011 | FY2012 | FY2013 | FY2014 | FY2015 | FY2016 | FY2017 | FY2018 | FY2019 | |
| Number of seizures | 3,691 | 3,244 | 3,586 | 5,793 | 6,500 | 7,255 | 8,022 | 14,678 | 13,657 | 14,992 | 14,841 | 19,959 | 24,792 | 22,848 | 24,361 | 23,140 | 23,140 | 28,865 | 34,143 | 33,810 | 27,599 |
| MSRP | NR | NR | NR | NR | NR | NR | NR | NR | NR | NR | NR | $ 1,413,480,374 | $ 1,110,432,844 | $ 1,262,202,478 | $ 1,743,515,581 | $ 1,226,347,540 | $ 1,226,347,540 | $ 1,352,495,341 | $ 1,206,382,219 | $ 1,399,873,842 | $ 1,555,269,057 |
| Domestic value | $ 98,501,594 | $ 45,327,526 | $ 57,438,680 | $ 98,990,341 | $ 94,019,227 | $ 138,767,885 | $ 93,234,510 | $ 155,369,236 | $ 196,754,377 | $ 272,728,879 | $ 260,697,937 | $ 188,125,346 | $ 178,322,633 | NR | NR | NR | NR | NR | NR | NR | NR |
| H&S number of seizures | NR | NR | NR | NR | NR | NR | NR | NR | 1,295 | 1,950 | 1,543 | 3,052 | 4,369 | 3,402 | 3,622 | 3,744 | 4,577 | 4,897 | 4,171 | 5,329 | 5,859 |
| H&S seizures % of total | NR | NR | NR | NR | NR | NR | NR | NR | 9% | 13% | 10% | 15% | 18% | 15% | 15% | 16% | 20% | 17% | 12% | 16% | 21% |
| H&S MSRP | NR | NR | NR | NR | NR | NR | NR | NR | NR | NR | NR | NR | $ 195,905,108 | $ 146,422,566 | $ 137,146,951 | $ 125,606,182 | NR | NR | NR | NR | NR |
| H&S domestic value | NR | NR | NR | NR | NR | NR | NR | NR | $ 27,892,624 | $ 62,535,472 | $ 32,431,797 | $ 42,406,512 | $ 60,063,354 | NR | NR | NR | NR | NR | NR | NR | NR |
Section 2 – Transport Breakdown
Data in this section relate to breakdowns by mode of transport. These charts show the transport types used to facilitate the importation of IPR infringing product into the US.
2.1 Transport Breakdown by Number of Seizures
This chart displays transport breakdown by IPR seizures. As such, transport methods which trend towards higher number of seizures, although lower infringing articles per seizure dominant, specifically Express and Mail. There is no breakdown of transport method by infringing articles provided by CBP.
2.1.1 Date Table
| FY2007 | FY2008 | FY2009 | FY2010 | FY2011 | FY2012 | FY2013 | FY2014 | FY2015 | FY2016 | FY2017 | FY2018 | FY2019 | |
| Express | 3148 | 3965 | 3574 | 6116 | 10090 | 8490 | 11196 | 12623 | 14897 | 17363 | 20417 | 21632 | 15811 |
| 6881 | 7341 | 7569 | 9743 | 8352 | 9852 | 8558 | 7300 | 10834 | 11326 | 9992 | 9643 | 8982 | |
| Cargo | 2494 | 2289 | 2519 | 2309 | 2930 | 1526 | 1654 | 1423 | 1287 | 1621 | 2628 | 1673 | 1903 |
| Other | 1134 | 1397 | 1179 | 1791 | 3420 | 2980 | 2953 | 1794 | 1847 | 1250 | 1106 | 862 | 903 |
| Total | 13657 | 14992 | 14841 | 19959 | 24792 | 22848 | 24361 | 23140 | 28865 | 31560 | 34143 | 33810 | 27599 |
Section 3 – Product Category Breakdown
Data in this section relate to product category breakdowns. All figures are for number of seizures within the specific product category. Product categorisation is reported by CBP using the top 10 product categories for the past financial year, and all other seizures grouped into an ‘other’ category. Therefore, due to fluctuations in product seizures, categories fall in and out, making it difficult to analyse long-term trends. Another difficutly in analysing the data is due to the change in value method, with domestic value no longer being reported since FY 2011.
*The product category “Watches / Jewelry” was first reported in FY 2013. Previously, watches and jewelry had been separate categories.
3.1 Product Category Breakdown by MSRP
This table shows the MSRP value for the number of seizures covering the top 10 product categories per year. The total gives the same MSRP as for total number of seizures, with the “other” category incorporating all seizures outside of the top 10 categories.
| FY2010 | FY2011 | FY2012 | FY2013 | FY2014 | FY2015 | FY2016 | FY2017 | FY2018 | FY2019 | |
| Automotive / Aerospace | NR | NR | NR | NR | NR | NR | $ 55,199,025 | NR | $ 14,861,590 | $ 12,142,621 |
| Batteries | NR | NR | NR | NR | NR | NR | NR | NR | NR | NR |
| Cigarettes | $ 12,062,987 | $ 10,940,851 | NR | NR | NR | NR | NR | NR | NR | NR |
| Computers / Technology Components | $ 33,874,319 | $ 22,644,506 | $ 34,710,624 | $ 47,731,513 | $ 26,652,422 | $ 38,393,149 | $ 19,319,416 | NR | $ 29,939,882 | $ 13,216,628 |
| Consumer Electronics | $ 87,810,943 | $ 101,183,537 | $ 104,391,141 | $ 145,866,526 | $ 162,209,441 | $ 132,478,776 | $ 122,892,442 | $ 46,265,355 | $ 89,593,498 | $ 105,957,198 |
| Consumer Products | NR | NR | NR | NR | NR | NR | NR | NR | $ 40,846,424 | $ 27,907,721 |
| Footwear | $ 183,577,213 | $ 96,976,959 | $ 103,365,939 | $ 54,886,032 | $ 49,522,859 | $ 64,967,315 | $ 51,231,396 | $ 41,490,429 | $ 77,500,746 | $ 37,994,046 |
| Handbags / Wallets / Backpacks | $ 537,309,551 | NR | $ 511,248,074 | $ 700,177,456 | $ 342,031,595 | $ 208,378,624 | $ 234,078,645 | $ 234,451,926 | $ 226,505,542 | $ 212,781,760 |
| Headwear | NR | NR | NR | NR | NR | NR | NR | NR | NR | NR |
| Health Care | NR | NR | NR | NR | NR | NR | NR | NR | NR | NR |
| Jewelry* | $ 48,422,129 | NR | NR | NR | NR | NR | NR | NR | NR | NR |
| Labels / Tags | NR | NR | $ 26,282,098 | $ 41,768,528 | $ 17,675,452 | $ 33,335,825 | $ 17,052,517 | $ 80,951,055 | NR | $ 10,378,772 |
| Media | $ 19,405,410 | $ 35,011,049 | $ 38,404,732 | $ 26,830,902 | $ 18,780,989 | $ 32,504,467 | $ 8,165,968 | $ 27,573,775 | NR | NR |
| Other | $ 155,956,257 | $ 501,727,809 | $ 27,200,685 | $ 18,837,223 | $ 39,273,404 | $ 19,630,248 | $ 36,851,145 | $ 73,604,401 | $ 45,247,665 | $ 55,219,321 |
| Perfumes / Colognes | NR | $ 50,973,598 | NR | NR | NR | NR | NR | NR | NR | NR |
| Pharmaceuticals | $ 6,149,303 | $ 25,145,074 | $ 82,997,515 | $ 79,636,801 | $ 72,939,399 | $ 75,061,822 | $ 73,716,381 | $ 69,758,720 | $ 131,457,724 | $ 48,771,870 |
| Sunglasses / Parts | NR | NR | NR | NR | NR | NR | NR | NR | NR | NR |
| Toys / Electronic Games | NR | $ 26,857,045 | $ 13,603,356 | $ 8,794,285 | $ 8,178,351 | $ 9,757,358 | NR | $ 12,128,156 | $ 10,590,281 | NR |
| Watches / Jewelry* | NR | NR | NR | $ 502,836,275 | $ 375,397,333 | $ 580,791,647 | $ 653,590,442 | $ 460,162,145 | $ 618,166,688 | $ 687,167,057 |
| Watches / Parts* | $ 181,106,392 | $ 112,672,972 | $ 186,990,133 | NR | NR | NR | NR | NR | NR | NR |
| Wearing Apparel | $ 147,805,871 | $ 126,299,443 | $ 133,008,182 | $ 116,150,041 | $ 113,686,295 | $ 157,196,110 | $ 110,805,624 | $ 74,880,617 | $ 115,163,801 | $ 343,732,063 |
3.2 Product Category Breakdown by Domestic Value
This table shows the domestic value for the number of seizures covering the top 10 product categories per year. The total gives the same domestic as for total number of seizures, with the “other” category incorporating all seizures outside of the top 10 categories. Domestic value for product category breakdowns has been discontinued since FY 2011.
| FY2002 | FY2003 | FY2004 | FY2005 | FY2006 | FY2007 | FY2008 | FY2009 | FY2010 | FY2011 | |
| Batteries | NR | NR | $ 2,318,603 | NR | NR | NR | NR | NR | NR | NR |
| Cigarettes | $ 37,579,894 | $ 41,720,129 | $ 24,161,416 | $ 9,648,876 | NR | NR | $ 6,444,649 | NR | $ 8,851,376 | $ 8,183,993 |
| Computers / Technology Components | NR | NR | $ 1,683,811 | $ 4,798,852 | $ 14,287,989 | $ 9,336,893 | $ 7,589,534 | $ 12,546,098 | $ 9,501,871 | $ 7,814,457 |
| Consumer Electronics | $ 5,307,407 | $ 3,779,736 | $ 8,880,133 | $ 8,793,700 | $ 7,057,034 | $ 16,041,694 | $ 22,997,685 | $ 31,773,625 | $ 33,588,493 | $ 38,992,613 |
| Footwear | NR | $ 2,555,386 | $ 2,048,523 | $ 8,941,185 | $ 63,445,619 | $ 77,781,415 | $ 102,316,577 | $ 99,779,263 | $ 45,749,639 | $ 25,252,613 |
| Handbags / Wallets / Backpacks | $ 2,927,194 | $ 11,458,259 | $ 23,189,817 | $ 14,954,525 | $ 14,750,201 | $ 14,214,304 | $ 29,609,053 | $ 21,501,614 | $ 15,422,201 | NR |
| Headwear | $ 1,043,252 | $ 1,286,198 | NR | NR | $ 3,257,963 | $ 2,902,362 | NR | NR | NR | NR |
| Health Care | NR | NR | NR | NR | $ 3,092,919 | NR | NR | NR | NR | NR |
| Jewelry | NR | NR | NR | NR | NR | NR | NR | $ 10,499,243 | $ 6,761,698 | NR |
| Media | $ 28,396,287 | $ 7,357,876 | $ 5,050,269 | NR | $ 6,965,156 | $ 7,884,152 | $ 5,967,332 | $ 11,099,758 | $ 12,681,213 | $ 15,567,059 |
| Other | $ 7,296,356 | $ 5,697,414 | $ 13,183,974 | $ 13,550,028 | $ 13,060,321 | $ 13,142,322 | $ 29,941,771 | $ 19,941,004 | $ 23,376,931 | $ 25,419,276 |
| Perfumes / Colognes | NR | NR | NR | $ 2,713,695 | NR | NR | $ 6,716,735 | NR | NR | $ 9,456,208 |
| Pharmaceuticals | NR | NR | NR | $ 2,094,352 | $ 2,298,694 | $ 11,137,578 | $ 28,106,578 | $ 11,057,991 | $ 5,662,334 | $ 16,848,192 |
| Sunglasses / Parts | $ 1,074,798 | $ 1,380,542 | NR | NR | NR | $ 3,951,758 | $ 7,919,385 | NR | NR | NR |
| Toys / Electronic Games | $ 2,150,847 | $ 1,510,839 | $ 3,971,321 | $ 8,568,925 | NR | NR | NR | $ 5,503,143 | NR | $ 7,597,367 |
| Watches / Parts | $ 3,919,331 | $ 3,384,025 | $ 2,543,387 | $ 3,070,832 | $ 2,832,364 | $ 13,355,985 | NR | $ 15,533,922 | $ 7,847,865 | $ 8,435,256 |
| Wearing Apparel | $ 9,294,975 | $ 13,888,823 | $ 51,736,651 | $ 16,099,540 | $ 24,320,976 | $ 27,005,914 | $ 25,119,580 | $ 21,462,276 | $ 18,681,725 | $ 14,755,599 |
Sources:
Intellectual Property Rights: Fiscal Year Seizure Statistics released annually by the US Customs and Border Protection Office of Trade – a federal agency of Homeland Security
Click here to access all publicly available reports via Dropbox.